

matto1233
-
Posts
313 -
Joined
-
Last visited
Content Type
Profiles
Joomla Posts 1
Chicago Cubs Videos
Chicago Cubs Free Agent & Trade Rumors, Notes, & Tidbits
2026 Chicago Cubs Top Prospects Ranking
News
2023 Chicago Cubs Draft Picks
Guides & Resources
2024 Chicago Cubs Draft Picks
The Chicago Cubs Players Project
2025 Chicago Cubs Draft Pick Tracker
2026 Chicago Cubs Draft Pick Tracker
Blogs
Events
Forums
Store
Gallery
Everything posted by matto1233
-
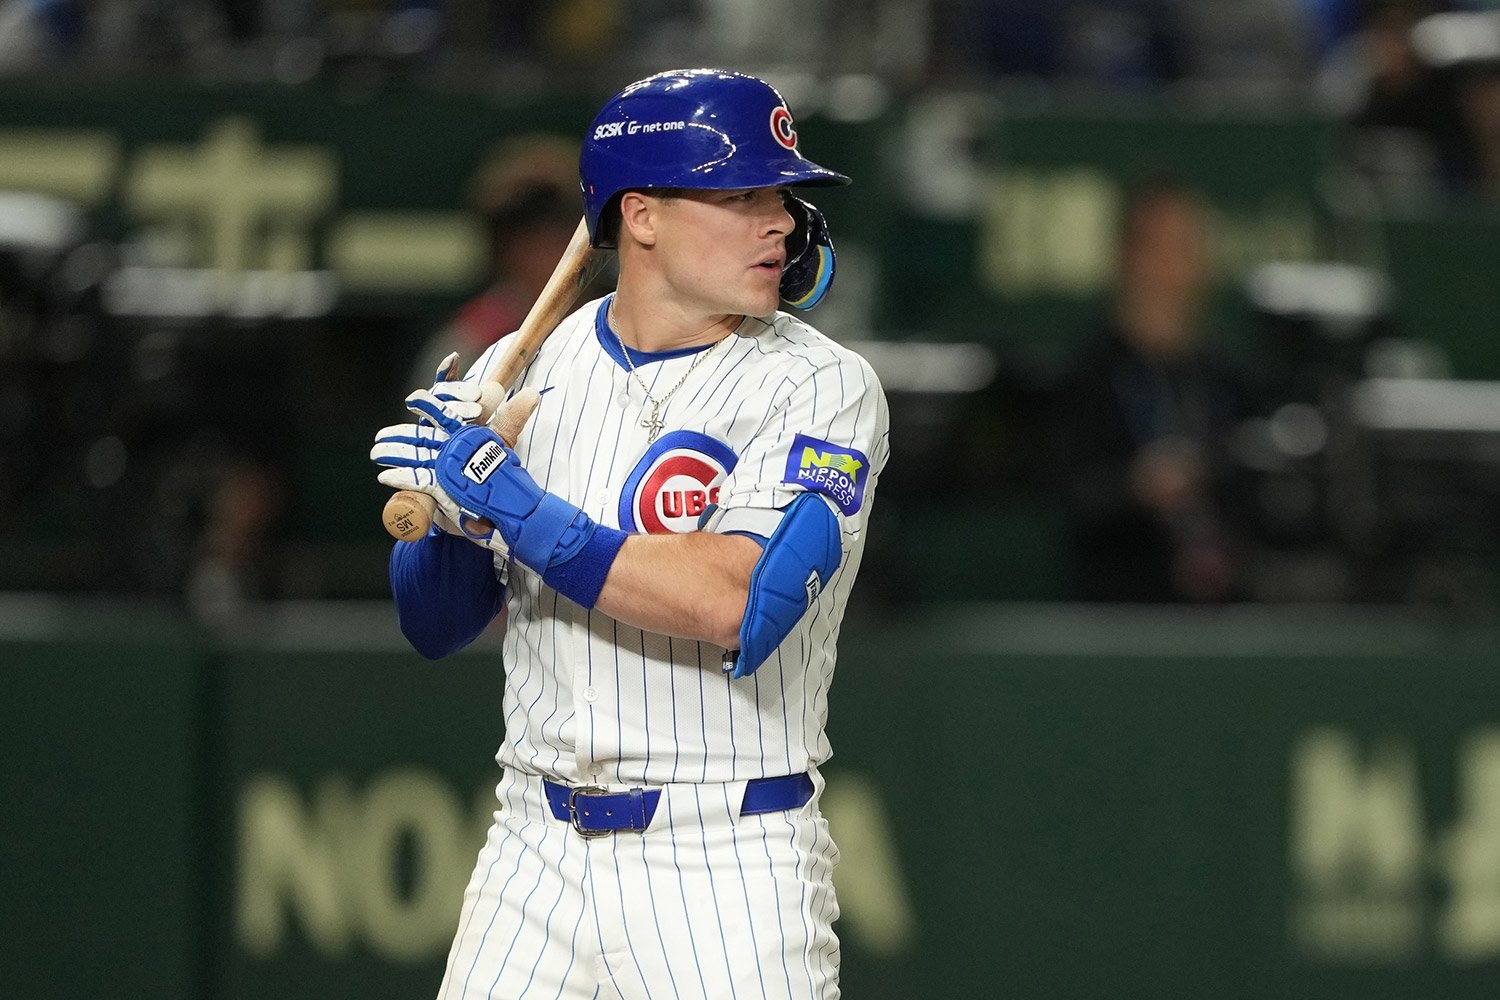
 Amidst all of the talk over who the Chicago Cubs might trade for before the trade deadline tomorrow, I find myself distracted by Pete Crow-Armstrong. It only makes sense, right? After all, this is the year of Pete Crow-Armstrong. You can point to the offseason acquisitions of Kyle Tucker and Matthew Boyd all you want, but the fact is that the Cubs would still be much closer to the middling team of the past couple of seasons without the sudden, and frankly unexpected, breakout of the young center fielder. You see, in last Tuesday’s win over the Kansas City Royals, Crow-Armstrong broke a record that I wanted to take a second to acknowledge. There was no mid-game ovation for it. There was no score bug signifying the accomplishment. It happened, and just as quickly as it happened, it was just another play in just another regular season game. In fact, Boog Sciambi, the terrific play-by-play voice of the Cubs, barely even interrupted his statement about liking the music on the previously read advertisement to call the play: QndvTWJfWGw0TUFRPT1fQmxWU0FRY0RYbGNBVzFzQlZRQUhCQWRVQUZnQUJsQUFCd2NIVWxGVUF3Y0VVUVFB.mp4 What’s so significant about that catch? Because he had to cover 60ft in 3.8 seconds, that ball had a catch probability of 25 percent, according to Baseball Savant. The first significance of that catch is just how easy Crow-Armstrong makes this stuff look. Most of us probably didn’t think twice about that catch. A lesser center fielder doesn’t get to that ball, or has to dive to even make contact with that ball. The Cubs’ center fielder, though, catches that on his two feet, and as previously mentioned, the play-by-play announcer doesn’t even raise his voice. With a catch probability at 25 percent, that makes that a five-star catch for Pete Crow-Armstrong. This means he now has 13 five-star catches this season, officially breaking the record for the most such catches in a season. Byron Buxton had 12 five-star catches in 2017, and Billy Hamilton had 12 of them in 2016. Buxton, it should be noted, had 1,143 innings in the field in 2017, and 26 opportunities to make a five-star catch. Hamilton had 1,175 ⅓ innings in the field and 22 opportunities to make a five-star catch in his own exemplary campaign. Through Sunday’s action, Crow-Armstrong has just 917 ⅔ innings in the field and 20 opportunities. Let this be a reminder to all of us about what truly makes Pete Crow-Armstrong great: he is a generational defender at a premium position. We can all doubt the validity or sustainability of the offensive numbers. I still do. He swings way too much for me to believe he is as good of a hitter as he has been to this point this season. In fact, we might be seeing his absolute ceiling this season at the plate, and that’s okay. It very well could win him the National League Most Valuable Player award. He doesn’t have to post a 137 wRC+, as he currently has to this point in 2025, to be an incredibly valuable player. He just has to keep racking up five-star catches in center field. And that, I am certain he will do.
 -
Image courtesy of © David Banks-Imagn Images Amidst all of the talk over who the Chicago Cubs might trade for before the trade deadline tomorrow, I find myself distracted by Pete Crow-Armstrong. It only makes sense, right? After all, this is the year of Pete Crow-Armstrong. You can point to the offseason acquisitions of Kyle Tucker and Matthew Boyd all you want, but the fact is that the Cubs would still be much closer to the middling team of the past couple of seasons without the sudden, and frankly unexpected, breakout of the young center fielder. You see, in last Tuesday’s win over the Kansas City Royals, Crow-Armstrong broke a record that I wanted to take a second to acknowledge. There was no mid-game ovation for it. There was no score bug signifying the accomplishment. It happened, and just as quickly as it happened, it was just another play in just another regular season game. In fact, Boog Sciambi, the terrific play-by-play voice of the Cubs, barely even interrupted his statement about liking the music on the previously read advertisement to call the play: QndvTWJfWGw0TUFRPT1fQmxWU0FRY0RYbGNBVzFzQlZRQUhCQWRVQUZnQUJsQUFCd2NIVWxGVUF3Y0VVUVFB.mp4 What’s so significant about that catch? Because he had to cover 60ft in 3.8 seconds, that ball had a catch probability of 25 percent, according to Baseball Savant. The first significance of that catch is just how easy Crow-Armstrong makes this stuff look. Most of us probably didn’t think twice about that catch. A lesser center fielder doesn’t get to that ball, or has to dive to even make contact with that ball. The Cubs’ center fielder, though, catches that on his two feet, and as previously mentioned, the play-by-play announcer doesn’t even raise his voice. With a catch probability at 25 percent, that makes that a five-star catch for Pete Crow-Armstrong. This means he now has 13 five-star catches this season, officially breaking the record for the most such catches in a season. Byron Buxton had 12 five-star catches in 2017, and Billy Hamilton had 12 of them in 2016. Buxton, it should be noted, had 1,143 innings in the field in 2017, and 26 opportunities to make a five-star catch. Hamilton had 1,175 ⅓ innings in the field and 22 opportunities to make a five-star catch in his own exemplary campaign. Through Sunday’s action, Crow-Armstrong has just 917 ⅔ innings in the field and 20 opportunities. Let this be a reminder to all of us about what truly makes Pete Crow-Armstrong great: he is a generational defender at a premium position. We can all doubt the validity or sustainability of the offensive numbers. I still do. He swings way too much for me to believe he is as good of a hitter as he has been to this point this season. In fact, we might be seeing his absolute ceiling this season at the plate, and that’s okay. It very well could win him the National League Most Valuable Player award. He doesn’t have to post a 137 wRC+, as he currently has to this point in 2025, to be an incredibly valuable player. He just has to keep racking up five-star catches in center field. And that, I am certain he will do. View full article
-
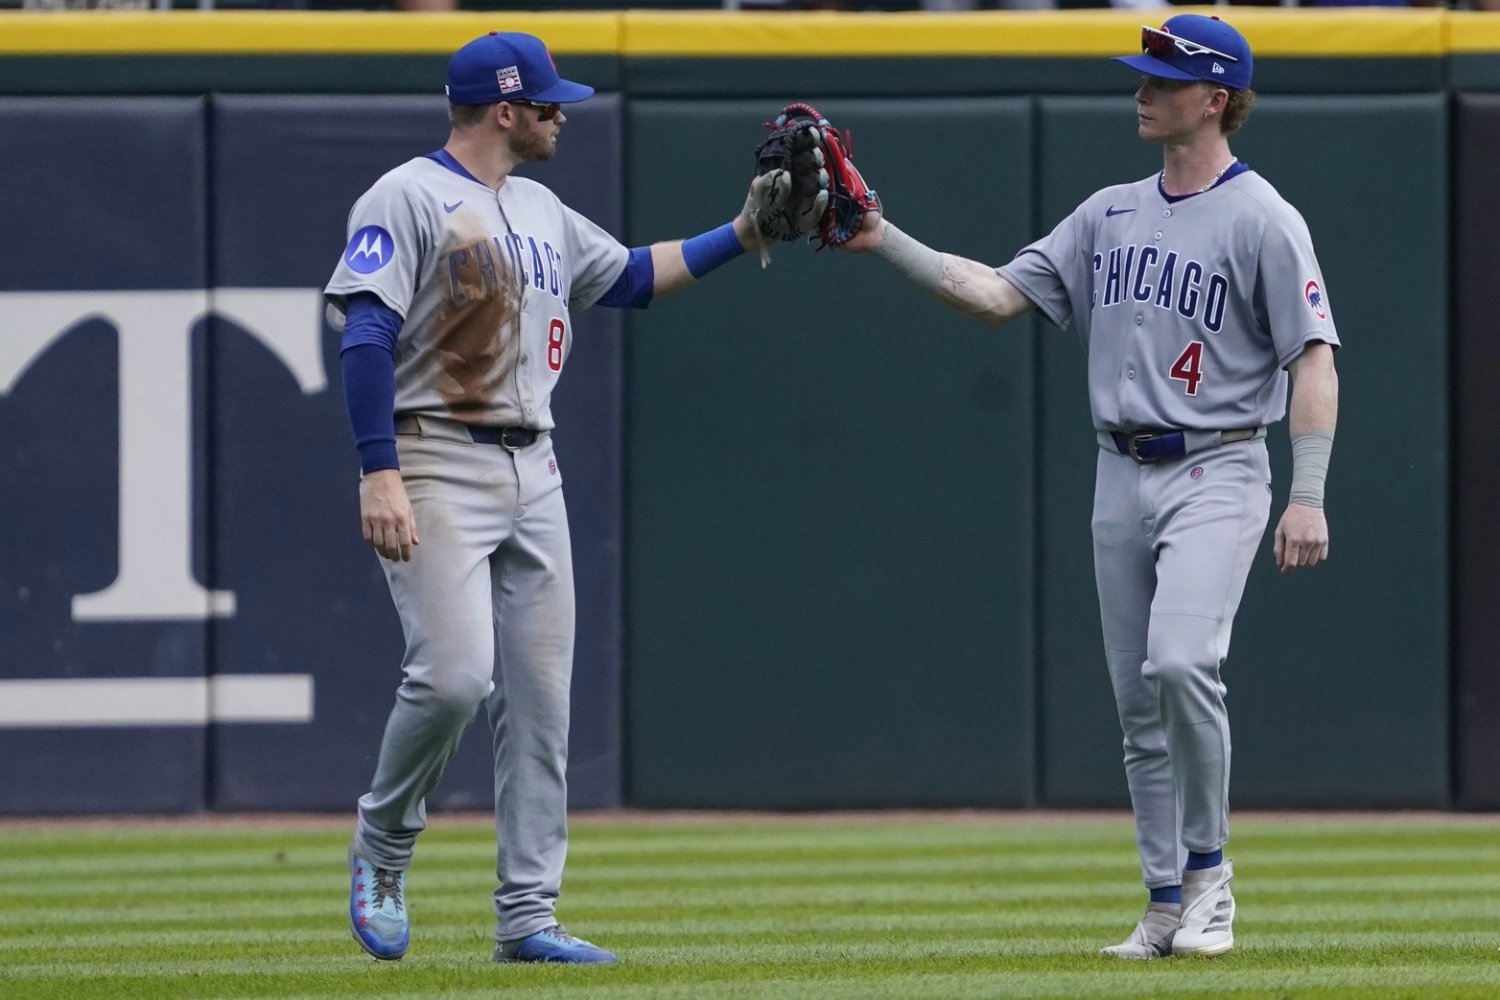
Image courtesy of © Jordan Johnson-Imagn Images Last Sunday, in the Chicago Cubs’ win over the New York Yankees, something that almost never happens on a baseball field happened. In fact, I didn’t see the game live, but when I saw this play pop up on the MLB Gameday feed, I made note to go look at the highlight later: Did you notice it? Nico Hoerner swung and missed at a pitch right down the middle of the plate. This happens so infrequently that it almost takes my brain another second or two to process what happened. It’s like Steph Curry missing a wide-open three pointer. My brain sees him go into that shooting motion and it closes the loop for me. That ball is basically already through the hoop. I have seen it so many times. When my brain sees Nico Hoerner start to swing, it assumes the ball is going to be hit in play. This didn’t compute. Hoerner himself even seems a bit perplexed at the result. Take a peak at him right after the strikeout, looking at his bat, examining it, potentially expecting to find a large, baseball-sized hole somewhere on it. Surely, that’s the only reasonable explanation here: For the uninitiated, the Cubs’ second baseman has a strikeout rate of just 7.4 percent this season, according to FanGraphs. That is the second-lowest in baseball among qualified hitters, with only Luis Arraez, who is almost entirely allergic to striking out, sitting in front of him. So, Hoerner striking out at all is rare enough. But wait, there’s more! Not only did he strike out—he did so swinging. His swinging strike rate is a minuscule 4.8 percent. That’s actually only good enough for seventh-lowest among qualified hitters. Still, the league-wide average is 10.8 percent. Of Hoerner’s 28 strikeouts this season, 17 of them were of the swinging variety. Still, we can take this even further, because like an ogre, or an onion, this has layers (shout out my fellow Shrek fans). Not only did Hoerner strikeout on a swing and miss, he struck out on a swing and a miss in the strike zone. Per FanGraphs, the Gold Glover leads all of baseball, Arraez included, at making contact inside the strike zone, doing so on 97.5 percent of swings. He has only swung and missed at a pitch that would have been a strike 19 times this season, according to Baseball Savant, and only one other time has he struck out on such a pitch. It looked like this: That is hardly the same thing. For one, that pitch was almost unhittable, resulting in an emergency swing from Hoerner. Second, it was right on the edge. It might not have even been called a strike had he let it pass by. Which brings me to my last point. Not only did Nico Hoerner strikeout, not only was it swinging, and not only was it a pitch in the strike zone. It was also on a fastball right down the middle of the plate. Nobody misses those pitches. Surely our contact king never would. That’s the most hittable pitch in baseball. This marks the first time this season he has swung and missed on such a pitch, and just the third time in his whole career he has struck out on one. That’s the thing about Nico Hoerner. He doesn’t always make loud contact, but he almost always makes contact... except for when he doesn’t and it leaves my brain scrambling. Quite frankly, I, too, would be checking that bat for holes. View full article
-
 Last Sunday, in the Chicago Cubs’ win over the New York Yankees, something that almost never happens on a baseball field happened. In fact, I didn’t see the game live, but when I saw this play pop up on the MLB Gameday feed, I made note to go look at the highlight later: Did you notice it? Nico Hoerner swung and missed at a pitch right down the middle of the plate. This happens so infrequently that it almost takes my brain another second or two to process what happened. It’s like Steph Curry missing a wide-open three pointer. My brain sees him go into that shooting motion and it closes the loop for me. That ball is basically already through the hoop. I have seen it so many times. When my brain sees Nico Hoerner start to swing, it assumes the ball is going to be hit in play. This didn’t compute. Hoerner himself even seems a bit perplexed at the result. Take a peak at him right after the strikeout, looking at his bat, examining it, potentially expecting to find a large, baseball-sized hole somewhere on it. Surely, that’s the only reasonable explanation here: For the uninitiated, the Cubs’ second baseman has a strikeout rate of just 7.4 percent this season, according to FanGraphs. That is the second-lowest in baseball among qualified hitters, with only Luis Arraez, who is almost entirely allergic to striking out, sitting in front of him. So, Hoerner striking out at all is rare enough. But wait, there’s more! Not only did he strike out—he did so swinging. His swinging strike rate is a minuscule 4.8 percent. That’s actually only good enough for seventh-lowest among qualified hitters. Still, the league-wide average is 10.8 percent. Of Hoerner’s 28 strikeouts this season, 17 of them were of the swinging variety. Still, we can take this even further, because like an ogre, or an onion, this has layers (shout out my fellow Shrek fans). Not only did Hoerner strikeout on a swing and miss, he struck out on a swing and a miss in the strike zone. Per FanGraphs, the Gold Glover leads all of baseball, Arraez included, at making contact inside the strike zone, doing so on 97.5 percent of swings. He has only swung and missed at a pitch that would have been a strike 19 times this season, according to Baseball Savant, and only one other time has he struck out on such a pitch. It looked like this: That is hardly the same thing. For one, that pitch was almost unhittable, resulting in an emergency swing from Hoerner. Second, it was right on the edge. It might not have even been called a strike had he let it pass by. Which brings me to my last point. Not only did Nico Hoerner strikeout, not only was it swinging, and not only was it a pitch in the strike zone. It was also on a fastball right down the middle of the plate. Nobody misses those pitches. Surely our contact king never would. That’s the most hittable pitch in baseball. This marks the first time this season he has swung and missed on such a pitch, and just the third time in his whole career he has struck out on one. That’s the thing about Nico Hoerner. He doesn’t always make loud contact, but he almost always makes contact... except for when he doesn’t and it leaves my brain scrambling. Quite frankly, I, too, would be checking that bat for holes.
 -
Image courtesy of © Gregory Fisher-Imagn Images I’m fairly certain that a relief pitcher is already on the trade deadline shopping list for the Chicago Cubs. However, after a couple of worrisome performances from Brad Keller, should the North Siders place an even greater emphasis on trading for some help? After a stellar first three months of the season that saw him post a 1.91 ERA and an almost equally good 2.45 FIP, Brad Keller has had a rough start to July. Since the first of this month, the veteran righty has a 14.54 ERA and a horrid 12.32 FIP. This is after allowing just one earned run from April 25 through July 4. All seven of the runs he has given up in July came in two outings. Keller has been such an integral part of a bullpen that has really carried the Cubs through June, when the bats cooled off a bit. Is this going to be a cause for concern going forward? The first thing I think when I see a reliever suddenly start giving up runs is that his velocity is down. The good news here is that it’s not. For the season, Keller averages 97.1 mph on his fastball, 96.6 mph on his sinker, 87.0 mph on his slider, and 92.4 mph on his changeup, according to FanGraphs. In his two subpar outings this month, he was almost right on those figures, give or take a couple of tenths of a mile per hour. Velocity is not the issue. Is his pitch movement worsening? According to Stuff+, which evaluates the overall physical characteristics of a pitch, with 100 being average, that’s also not the case. Keller has a rating of 105 prior to July, and it’s been 100 since. A decline, sure, but not necessarily a drastic or terribly concerning one. Let’s go back to the bad outing last week against the St. Louis Cardinals. Keller got Willson Contreras to lazily fly out to start the inning. Then, Alec Burleson cut into the Cubs’ lead with a home run to center field: OHl3NVBfWGw0TUFRPT1fVTFSWlZsWlFCRkVBRGdZSFVBQUhBRkJYQUZnTkFBQUFVVlVFQ0ZFTkJWY0hCMU5R.mp4 High fastballs aren’t always a bad thing—if you have a fastball that rises a lot. The issue here is that Keller has one of those cutting fastballs that the Cubs have become so famous for, and he typically tries to keep it lower in the zone. In fact, per Baseball Savant, hitters are slugging .786 on Brad Keller fastballs in the upper third of the strike zone. Whoops! After the home run, Thomas Saggese reached his bat out and singled to right field on a pitch that was going to bounce in the dirt, and that had an exit velocity of 64 mph. Then, Lars Nootbaar had a bunt single. After that, Nolan Gorman had a ground ball single. Then came the big blow: OHl3NVBfWGw0TUFRPT1fVjFOUlhWUUNVbFlBV1ZWUUJBQUhWd05lQUFBTUJWQUFBVkJRVkZaUkIxQmNBQUJU.mp4 I don’t even think I need to tell you that that is not where Keller wanted to throw that pitch. Here’s Keller’s heat map for sliders to right-handed hitters this year: Keller, like almost every other pitcher, goes down and away with his slider. His pitch to Yohel Pozo was… not down and away. He missed his spot. Badly. Fast-forward to this past weekend against Aaron Judge, and this might look familiar: A fastball up! I have a huge issue with throwing a fastball to Aaron Judge while up 0-2 in the count in a five-run game, too, but that’s not the thing this article is tackling. If you look at where Carson Kelly sets up, it’s clear that they wanted this pitch way up and out of the strike zone, likely to set up the slider. Keller missed his spot. Again. And paid the price. Again. So what does all of this mean? You are free to interpret that in your own way. Me personally? I feel a tad better about Keller’s struggles this month after this. He made bad pitches to Gorman, Pozo, and Aaron freakin’ Judge, and in between Gorman and Pozo, he had a whole lot of unfortunate luck. Pitchers make mistakes. These weren’t the first ones Keller has made this season. They’re simply the first ones in a while that were punished for home runs. Actually, they are the first three home runs he has given up all season. Relief pitchers are, unfortunately, volatile like that. Their sample sizes are so small, and suddenly, a couple of bad outings, and their ERA balloons. Keller probably won’t continue to be the sub-2.00 ERA pitcher he was for the first three months, though I do still expect him to be a solid contributor for the bullpen going forward. The velocity and stuff are still there. He simply had a couple of bad outings and made a few bad pitches. All easily correctable things—we hope. View full article
-
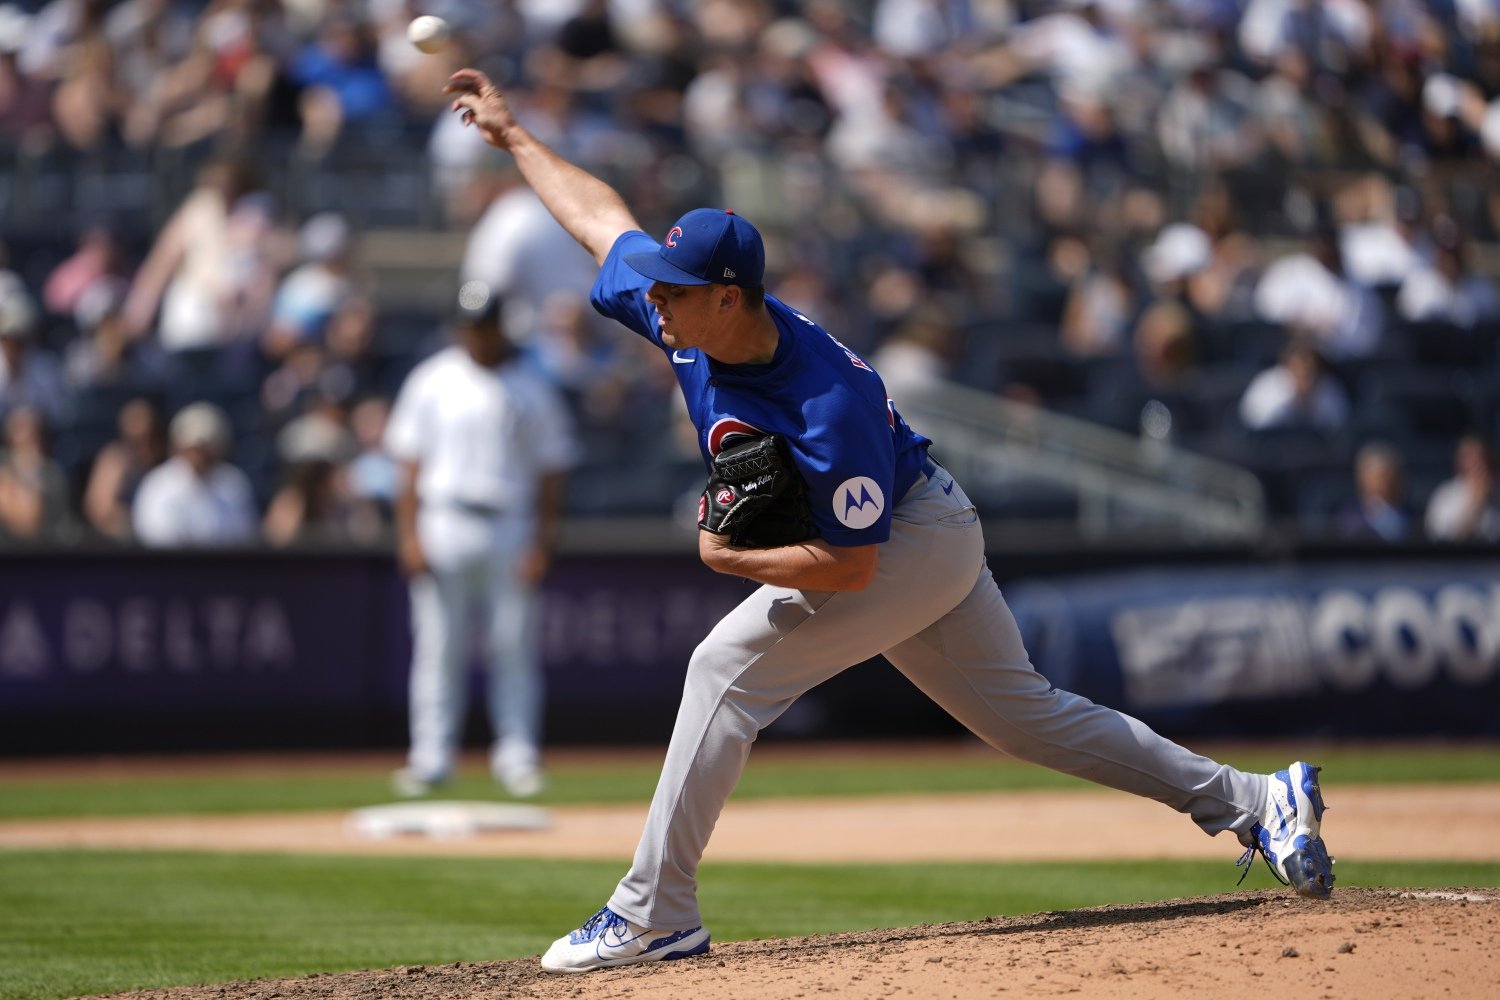 I’m fairly certain that a relief pitcher is already on the trade deadline shopping list for the Chicago Cubs. However, after a couple of worrisome performances from Brad Keller, should the North Siders place an even greater emphasis on trading for some help? After a stellar first three months of the season that saw him post a 1.91 ERA and an almost equally good 2.45 FIP, Brad Keller has had a rough start to July. Since the first of this month, the veteran righty has a 14.54 ERA and a horrid 12.32 FIP. This is after allowing just one earned run from April 25 through July 4. All seven of the runs he has given up in July came in two outings. Keller has been such an integral part of a bullpen that has really carried the Cubs through June, when the bats cooled off a bit. Is this going to be a cause for concern going forward? The first thing I think when I see a reliever suddenly start giving up runs is that his velocity is down. The good news here is that it’s not. For the season, Keller averages 97.1 mph on his fastball, 96.6 mph on his sinker, 87.0 mph on his slider, and 92.4 mph on his changeup, according to FanGraphs. In his two subpar outings this month, he was almost right on those figures, give or take a couple of tenths of a mile per hour. Velocity is not the issue. Is his pitch movement worsening? According to Stuff+, which evaluates the overall physical characteristics of a pitch, with 100 being average, that’s also not the case. Keller has a rating of 105 prior to July, and it’s been 100 since. A decline, sure, but not necessarily a drastic or terribly concerning one. Let’s go back to the bad outing last week against the St. Louis Cardinals. Keller got Willson Contreras to lazily fly out to start the inning. Then, Alec Burleson cut into the Cubs’ lead with a home run to center field: OHl3NVBfWGw0TUFRPT1fVTFSWlZsWlFCRkVBRGdZSFVBQUhBRkJYQUZnTkFBQUFVVlVFQ0ZFTkJWY0hCMU5R.mp4 High fastballs aren’t always a bad thing—if you have a fastball that rises a lot. The issue here is that Keller has one of those cutting fastballs that the Cubs have become so famous for, and he typically tries to keep it lower in the zone. In fact, per Baseball Savant, hitters are slugging .786 on Brad Keller fastballs in the upper third of the strike zone. Whoops! After the home run, Thomas Saggese reached his bat out and singled to right field on a pitch that was going to bounce in the dirt, and that had an exit velocity of 64 mph. Then, Lars Nootbaar had a bunt single. After that, Nolan Gorman had a ground ball single. Then came the big blow: OHl3NVBfWGw0TUFRPT1fVjFOUlhWUUNVbFlBV1ZWUUJBQUhWd05lQUFBTUJWQUFBVkJRVkZaUkIxQmNBQUJU.mp4 I don’t even think I need to tell you that that is not where Keller wanted to throw that pitch. Here’s Keller’s heat map for sliders to right-handed hitters this year: Keller, like almost every other pitcher, goes down and away with his slider. His pitch to Yohel Pozo was… not down and away. He missed his spot. Badly. Fast-forward to this past weekend against Aaron Judge, and this might look familiar: A fastball up! I have a huge issue with throwing a fastball to Aaron Judge while up 0-2 in the count in a five-run game, too, but that’s not the thing this article is tackling. If you look at where Carson Kelly sets up, it’s clear that they wanted this pitch way up and out of the strike zone, likely to set up the slider. Keller missed his spot. Again. And paid the price. Again. So what does all of this mean? You are free to interpret that in your own way. Me personally? I feel a tad better about Keller’s struggles this month after this. He made bad pitches to Gorman, Pozo, and Aaron freakin’ Judge, and in between Gorman and Pozo, he had a whole lot of unfortunate luck. Pitchers make mistakes. These weren’t the first ones Keller has made this season. They’re simply the first ones in a while that were punished for home runs. Actually, they are the first three home runs he has given up all season. Relief pitchers are, unfortunately, volatile like that. Their sample sizes are so small, and suddenly, a couple of bad outings, and their ERA balloons. Keller probably won’t continue to be the sub-2.00 ERA pitcher he was for the first three months, though I do still expect him to be a solid contributor for the bullpen going forward. The velocity and stuff are still there. He simply had a couple of bad outings and made a few bad pitches. All easily correctable things—we hope.
 -
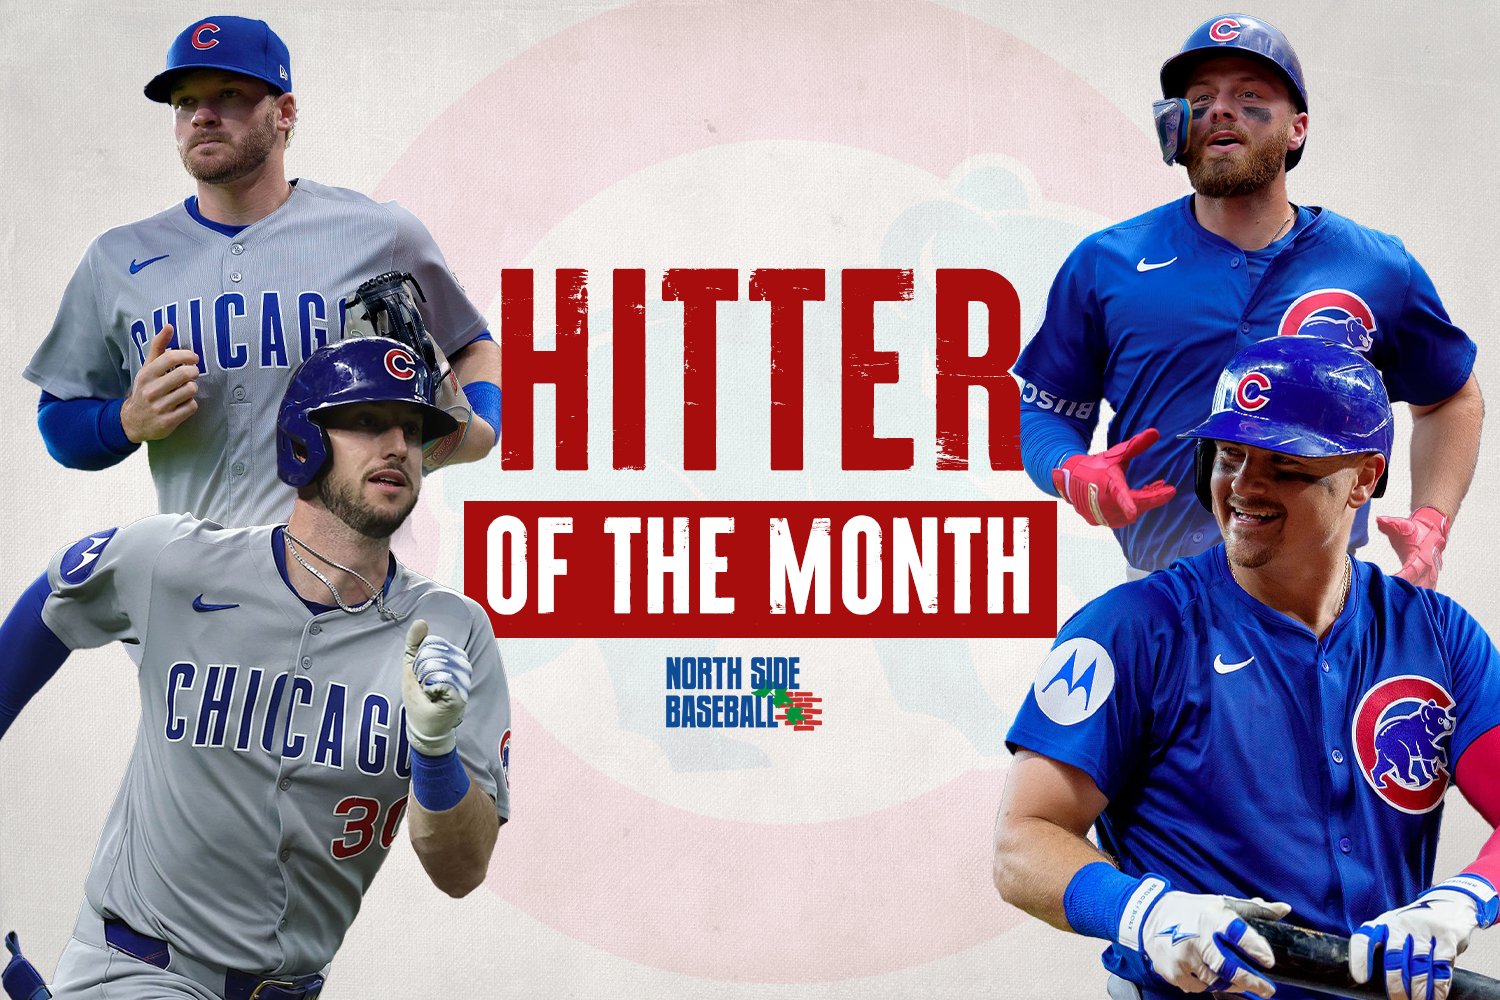 After scoring nearly six runs per game, second in all of baseball, over the course of the first couple months of the season, the Chicago Cubs’ offense came back down to earth a bit in the month of June. They scored about 4.5 runs per game, which was exactly average, 15th in baseball. That doesn’t mean there weren’t still performances to celebrate. Certain players kept the Cubs afloat while others regressed to the mean. Let’s take a look at North Side Baseball’s Cubs Hitter of the Month for June. Honorable Mention Reese McGuire (.244/.279/.488, 3 HR, 7 R, 6 RBI) The Cubs were probably worried about the production from the catcher position cratering when Miguel Amaya went down with an oblique injury at the end of May. And it has, though not because of McGuire. He’s actually been the one keeping them afloat. Carson Kelly struggled in June, to the tune of a 62 wRC+ (an all-encompassing offensive stat where 100 is average), according to FanGraphs. While McGuire’s batting line was good for a 112 wRC+, just a hair above league average, it’s been incredibly valuable given how unexpected it was. That alone deserves a shoutout. Will it continue? Probably not. But it might not have to for much longer with Amaya hopefully returning from his injury in July. Regardless, McGuire has filled the third catcher role with aplomb and deserves his flowers for seamlessly stepping in and replacing a crucial player. Third Place Ian Happ (.208/.298/.481, 9 HR, 16 R, 22 RBI) Happ’s overall slash line leaves a bit to be desired here, thanks to the drop in batting average, but his nine home runs led the team, as did his 22 RBIs from the leadoff spot. In a 19-game stretch from June 5 to June 25, Happ slugged all nine of those home runs and posted a .960 OPS, seemingly carrying the Cubs’ offense in the process. He was named the Cubs' Player of the Month for a reason. You can read more about Happ’s hot month from our own Matthew Trueblood. Second Place Kyle Tucker (.311/.404/.578, 5 HR, 18 R, 13 RBI) It certainly doesn’t feel like Tucker had a great month, yet he still somehow posted a 173 wRC+, his highest in any individual month so far as a Cub. He also posted his highest BABIP (batting average on balls in play), suggesting there might be some luck involved, but he is more than living up to the pre-season hype. As a matter of fact, the deeper you look into the numbers, the more confounding they get. He walked 12.5 percent of the time in June, the lowest in any month as a Cub, and struck out 19.2 percent of the time, the highest in any month. Both of those numbers are still really good, just not necessarily for someone with Tucker’s baseline. The first thing I think when I see that high batting average and BABIP is perhaps he started hitting more line drives. That is also not the case. In fact, his line drive rate fell precipitously, from about 22 percent in the first couple of months to 15 percent in June. His ground ball rate was up to 35.7 percent in June, and he hit a likely unsustainable .320 on those ground balls. He hit just .196 on ground balls in March, April, and May combined. But we shouldn't be all doom and gloom in a piece celebrating his success. As they say, great hitters find a way to succeed, and Tucker did just that. The Cubs should be glad to have him, and they should extend him so they can have him for even longer. Winner Michael Busch (.309/.385/.617, 7 HR, 13 R, 19 RBI) I’ve been trying to figure out the best way to write about this for a while now, so I’ll just go ahead and do this here: Michael Busch is trimming his strikeout rate, and it is doing wonders for his production. Busch’s strikeout rate of 28.6 percent last season was 11th worst in baseball. This season, he’s down to 21.9 percent, and in June, he struck out just 15.4 percent of the time. His swinging strike rate for his career sits at 11.3 percent. In June, it was just 7.3 percent. If the second-year first baseman maintains the decreased strikeout rate, months like this might just become the norm for him. His BABIP was right on par with his career number. He’s just putting the ball in play that much more often, reaping the rewards of it. What do you think of our list? Are there any other Cubs hitters you'd want to award for June? Let us know in the comments!
 -
Image courtesy of Thieres Rabelo After scoring nearly six runs per game, second in all of baseball, over the course of the first couple months of the season, the Chicago Cubs’ offense came back down to earth a bit in the month of June. They scored about 4.5 runs per game, which was exactly average, 15th in baseball. That doesn’t mean there weren’t still performances to celebrate. Certain players kept the Cubs afloat while others regressed to the mean. Let’s take a look at North Side Baseball’s Cubs Hitter of the Month for June. Honorable Mention Reese McGuire (.244/.279/.488, 3 HR, 7 R, 6 RBI) The Cubs were probably worried about the production from the catcher position cratering when Miguel Amaya went down with an oblique injury at the end of May. And it has, though not because of McGuire. He’s actually been the one keeping them afloat. Carson Kelly struggled in June, to the tune of a 62 wRC+ (an all-encompassing offensive stat where 100 is average), according to FanGraphs. While McGuire’s batting line was good for a 112 wRC+, just a hair above league average, it’s been incredibly valuable given how unexpected it was. That alone deserves a shoutout. Will it continue? Probably not. But it might not have to for much longer with Amaya hopefully returning from his injury in July. Regardless, McGuire has filled the third catcher role with aplomb and deserves his flowers for seamlessly stepping in and replacing a crucial player. Third Place Ian Happ (.208/.298/.481, 9 HR, 16 R, 22 RBI) Happ’s overall slash line leaves a bit to be desired here, thanks to the drop in batting average, but his nine home runs led the team, as did his 22 RBIs from the leadoff spot. In a 19-game stretch from June 5 to June 25, Happ slugged all nine of those home runs and posted a .960 OPS, seemingly carrying the Cubs’ offense in the process. He was named the Cubs' Player of the Month for a reason. You can read more about Happ’s hot month from our own Matthew Trueblood. Second Place Kyle Tucker (.311/.404/.578, 5 HR, 18 R, 13 RBI) It certainly doesn’t feel like Tucker had a great month, yet he still somehow posted a 173 wRC+, his highest in any individual month so far as a Cub. He also posted his highest BABIP (batting average on balls in play), suggesting there might be some luck involved, but he is more than living up to the pre-season hype. As a matter of fact, the deeper you look into the numbers, the more confounding they get. He walked 12.5 percent of the time in June, the lowest in any month as a Cub, and struck out 19.2 percent of the time, the highest in any month. Both of those numbers are still really good, just not necessarily for someone with Tucker’s baseline. The first thing I think when I see that high batting average and BABIP is perhaps he started hitting more line drives. That is also not the case. In fact, his line drive rate fell precipitously, from about 22 percent in the first couple of months to 15 percent in June. His ground ball rate was up to 35.7 percent in June, and he hit a likely unsustainable .320 on those ground balls. He hit just .196 on ground balls in March, April, and May combined. But we shouldn't be all doom and gloom in a piece celebrating his success. As they say, great hitters find a way to succeed, and Tucker did just that. The Cubs should be glad to have him, and they should extend him so they can have him for even longer. Winner Michael Busch (.309/.385/.617, 7 HR, 13 R, 19 RBI) I’ve been trying to figure out the best way to write about this for a while now, so I’ll just go ahead and do this here: Michael Busch is trimming his strikeout rate, and it is doing wonders for his production. Busch’s strikeout rate of 28.6 percent last season was 11th worst in baseball. This season, he’s down to 21.9 percent, and in June, he struck out just 15.4 percent of the time. His swinging strike rate for his career sits at 11.3 percent. In June, it was just 7.3 percent. If the second-year first baseman maintains the decreased strikeout rate, months like this might just become the norm for him. His BABIP was right on par with his career number. He’s just putting the ball in play that much more often, reaping the rewards of it. What do you think of our list? Are there any other Cubs hitters you'd want to award for June? Let us know in the comments! View full article
-
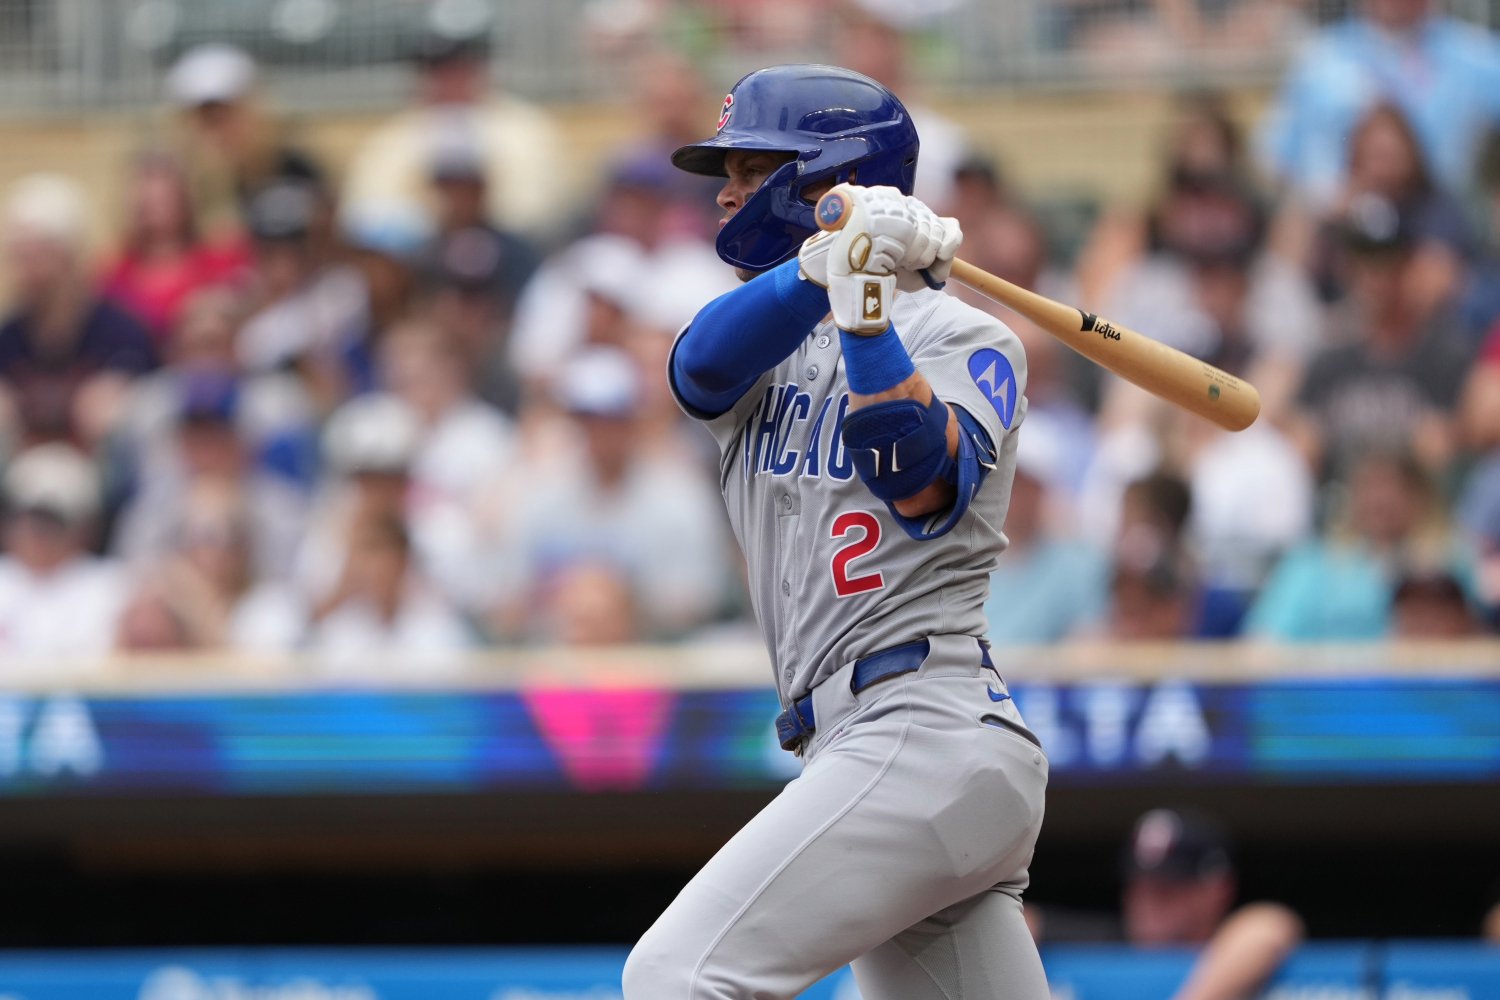
 After his recall from AAA Iowa, Matt Shaw briefly looked like he was starting to figure things out. His first game back with the big league club was on May 19. From then through June 7, he hit .339/.379/.500, good for a .879 OPS. Since then, he has been so putrid that I am starting to wonder if the Cubs have a legitimate Matt Shaw problem. In 41 plate appearances, he has just four hits and one extra-base hit, giving him a slash line of .105/.171/.132. This would be easy to forgive if the under-the-hood metrics looked better. The issue is: they don’t. Shaw has the lowest average exit velocity of any big league hitter that has at least 100 batted ball events, according to Baseball Savant. Exit velocity isn’t everything, but when it’s that low, we’re usually talking about a light-hitting, defense-first, utility type of player. Like, for example, Caleb Durbin, who sits just above Shaw on that leaderboard. For anyone that has routinely followed my writing, you might know I enjoy blind player comparisons. So, let’s do one here, in an attempt to illustrate how concerning Shaw’s current offensive profile is. All stats courtesy of Baseball Savant: Player Average Exit Velocity GB% FB% LD% Pull% Straight% Oppo% Shaw 82.4mph 44.6% 17.4% 28.1% 33.9% 30.6% 35.5% Mystery Player 87.3mph 46.6% 23.3% 24.0% 37.4% 35.9% 26.7% The "Mystery Player" in this instance probably isn’t a power hitter; they don’t hit the ball very hard, they hit the ball on the ground a lot, and aren’t a heavy pull or fly ball hitter. For reference, the league as a whole hits 38.8 percent of balls to the pull side this year, and 26.4 percent of balls in play have been fly balls. This appears to be a slap hitter, aiming for doubles down the lines rather than home runs. Turns out, Mystery Player is someone that Cubs fans are intimately familiar with: Nico Hoerner. Hoerner is not at all a power hitter, but compare him next to Shaw like this and suddenly, he almost looks like one! This isn’t an insult to the Cubs’ second baseman. To be clear, I love Nico Hoerner, and I love watching him play baseball. He’s posted three-straight four win seasons, per Fangraphs, and has a really good shot at a fourth this year. Hoerner succeeds for three reasons: he is arguably the best defender in baseball at second base, he is an elite baserunner, and his bat to ball skill is bested only by Luis Arraez. He might not hit for power, but he’ll always run a batting average well above league average just because he puts the ball in play almost every time up there. Shaw might be a decent baserunner, and he has improved defensively, but Nico Hoerner he is not. After all, Shaw is a guy that slugged 21 home runs in the minors last year. Hoerner topped out at three in the minor leagues and 10 in the majors. Take one glance through Shaw’s page at Baseball Savant, and it’s easy to see where a huge part of the issue lies: he is hitting .106 on fastballs with just a .206 wOBA (wOBA is an all-encompassing offensive statistic where roughly .320 is considered average). Both of those numbers are in the bottom-10 among all qualified big league hitters. Taking a look at where Shaw is being pitched in the month of June, and the issue becomes even greater: I am not a major league pitcher, in fact, I am far from it. But that big red dot that sits in the upper and inside part of the strike zone looks like somewhere I’d want to throw a fastball to someone I didn’t think could catch up to it, resulting in the low exit velocity and pull rate numbers from above. Here’s one example from just this past weekend. Shaw gets a 2-2 fastball on the inner part of the plate. While he almost drops it in front of the right fielder for a single, most hitters aren’t making a ton of money off of line drives at 83 mph off the bat. The best case scenario for that ball is a single. The result there looks very, dare I say… Nico Hoerner-ish. I don’t want to be all doom and gloom, but the Cubs have a very tough line to toe here. Lucky for the team, they can afford one lineup spot of subpar production since they are getting so many contributions from just about everywhere else. Shaw is their number one prospect, and sometimes, development needs to happen at the big league level. It took a year and a half for Pete Crow-Armstrong to figure it out, and he has figured it out in a big way, it seems. On the flip side of things, the Cubs are a team looking to compete right now. They have the fourth best record in baseball, and could easily rocket up to number one with a decent week — they have the second best run differential in MLB. All numbers point to them having a legitimate shot at a World Series. A team like that cannot afford to field a complete zero at third base, and it’s legitimately concerning that he can’t seem to be able to consistently hit a big league fastball. Their number one need is still on the pitching side of things, but if Matt Shaw doesn’t start to turn things around fast, the Cubs might need to look to replace him at next month’s trade deadline, at least for the remainder of this season.
 -
Image courtesy of © Darren Yamashita-Imagn Images After his recall from AAA Iowa, Matt Shaw briefly looked like he was starting to figure things out. His first game back with the big league club was on May 19. From then through June 7, he hit .339/.379/.500, good for a .879 OPS. Since then, he has been so putrid that I am starting to wonder if the Cubs have a legitimate Matt Shaw problem. In 41 plate appearances, he has just four hits and one extra-base hit, giving him a slash line of .105/.171/.132. This would be easy to forgive if the under-the-hood metrics looked better. The issue is: they don’t. Shaw has the lowest average exit velocity of any big league hitter that has at least 100 batted ball events, according to Baseball Savant. Exit velocity isn’t everything, but when it’s that low, we’re usually talking about a light-hitting, defense-first, utility type of player. Like, for example, Caleb Durbin, who sits just above Shaw on that leaderboard. For anyone that has routinely followed my writing, you might know I enjoy blind player comparisons. So, let’s do one here, in an attempt to illustrate how concerning Shaw’s current offensive profile is. All stats courtesy of Baseball Savant: Player Average Exit Velocity GB% FB% LD% Pull% Straight% Oppo% Shaw 82.4mph 44.6% 17.4% 28.1% 33.9% 30.6% 35.5% Mystery Player 87.3mph 46.6% 23.3% 24.0% 37.4% 35.9% 26.7% The "Mystery Player" in this instance probably isn’t a power hitter; they don’t hit the ball very hard, they hit the ball on the ground a lot, and aren’t a heavy pull or fly ball hitter. For reference, the league as a whole hits 38.8 percent of balls to the pull side this year, and 26.4 percent of balls in play have been fly balls. This appears to be a slap hitter, aiming for doubles down the lines rather than home runs. Turns out, Mystery Player is someone that Cubs fans are intimately familiar with: Nico Hoerner. Hoerner is not at all a power hitter, but compare him next to Shaw like this and suddenly, he almost looks like one! This isn’t an insult to the Cubs’ second baseman. To be clear, I love Nico Hoerner, and I love watching him play baseball. He’s posted three-straight four win seasons, per Fangraphs, and has a really good shot at a fourth this year. Hoerner succeeds for three reasons: he is arguably the best defender in baseball at second base, he is an elite baserunner, and his bat to ball skill is bested only by Luis Arraez. He might not hit for power, but he’ll always run a batting average well above league average just because he puts the ball in play almost every time up there. Shaw might be a decent baserunner, and he has improved defensively, but Nico Hoerner he is not. After all, Shaw is a guy that slugged 21 home runs in the minors last year. Hoerner topped out at three in the minor leagues and 10 in the majors. Take one glance through Shaw’s page at Baseball Savant, and it’s easy to see where a huge part of the issue lies: he is hitting .106 on fastballs with just a .206 wOBA (wOBA is an all-encompassing offensive statistic where roughly .320 is considered average). Both of those numbers are in the bottom-10 among all qualified big league hitters. Taking a look at where Shaw is being pitched in the month of June, and the issue becomes even greater: I am not a major league pitcher, in fact, I am far from it. But that big red dot that sits in the upper and inside part of the strike zone looks like somewhere I’d want to throw a fastball to someone I didn’t think could catch up to it, resulting in the low exit velocity and pull rate numbers from above. Here’s one example from just this past weekend. Shaw gets a 2-2 fastball on the inner part of the plate. While he almost drops it in front of the right fielder for a single, most hitters aren’t making a ton of money off of line drives at 83 mph off the bat. The best case scenario for that ball is a single. The result there looks very, dare I say… Nico Hoerner-ish. I don’t want to be all doom and gloom, but the Cubs have a very tough line to toe here. Lucky for the team, they can afford one lineup spot of subpar production since they are getting so many contributions from just about everywhere else. Shaw is their number one prospect, and sometimes, development needs to happen at the big league level. It took a year and a half for Pete Crow-Armstrong to figure it out, and he has figured it out in a big way, it seems. On the flip side of things, the Cubs are a team looking to compete right now. They have the fourth best record in baseball, and could easily rocket up to number one with a decent week — they have the second best run differential in MLB. All numbers point to them having a legitimate shot at a World Series. A team like that cannot afford to field a complete zero at third base, and it’s legitimately concerning that he can’t seem to be able to consistently hit a big league fastball. Their number one need is still on the pitching side of things, but if Matt Shaw doesn’t start to turn things around fast, the Cubs might need to look to replace him at next month’s trade deadline, at least for the remainder of this season. View full article
-
Thank you! Highly recommend Jason’s piece as well, of course. Welcome to NSBB!
-
Image courtesy of © Sergio Estrada-Imagn Images Just one week ago, our own Jason Ross broke down a plate appearance that CJ Abrams had against Cade Horton. Jason went pitch-by-pitch, examining what each pitch meant, and what the plate appearance as a whole signified for Horton’s development. I recommend you check that piece out, mostly because it’s a good article, but also because it’s inspired me to write a similar piece about one of Ben Brown’s showdowns against Kyle Schwarber from last week. Specifically, the one where Schwarber launched a home run. Before we jump into the plate appearance, let’s catch you up on where we’re at in the game. The Cubs find themselves in an early 3-0 hole, and the young right-hander is facing the Phillies' order the second time through. The first time he faced Schwarber, he walked him on a full count, throwing five fastballs and one curveball. Now, on to the plate appearance in question, with nobody on and nobody out in the third inning: Not a horrible pitch to start things off with, but also probably not precisely where Brown wanted it. Brown was either trying to sneak a curveball by Schwarber when he was anticipating a fastball for an easy strike one, or he was going for the chase down and out of the zone. The thing is, and Cubs fans are likely familiar with this. Schwarber is a tough player to get a chase from: he has swung at just 20.8 percent of pitches outside of the strike zone, according to FanGraphs. That is 15th lowest in baseball, and for comparison’s sake, the league average is 28 percent. Brown yanking that pitch inside a bit likely eliminated the chance for Schwarber to swing through it. Here’s the next pitch: A changeup, and a beauty at that. You can even see Schwarber give a little nod of approval after taking that pitch for a strike. This is the whole reason I wanted to write this piece to begin with. Since May 19, 7.1 percent of Brown’s pitches thrown have been changeups, per FanGraphs. That might not feel like a lot, but prior to May 19, it was just 2.3 percent, so he has more than tripled his usage of it. He needs a third pitch, and he is, at least, trying to incorporate the changeup more often. That pitch right there is what it looks like when he does so successfully. Now, for the 1-1 pitch: Another curveball, down and out of the zone that the former Cub spits on. Schwarber has now taken two of these pitches, and didn’t look particularly interested in swinging at either one. For someone like Brown, who has historically been a two-pitch pitcher, this puts him in a bind. He’s either not throwing the curveball well enough to get a chase from a guy like Schwarber, or, Schwarber is seeing it really well out of Brown’s hand. Neither is a good sign. According to FanGraphs, Brown is in the zone with his curveball only 43.5 percent of the time, and he gets chases on 40.2 percent of those pitches. He relies on hitters chasing his curveball down and out of the zone, and Schwarber wasn’t biting. This likely left Brown feeling like he couldn’t go to his best pitch. So, what pitch did he throw next? The changeup! Except that this one is incredibly poorly executed, and illustrates that Brown is clearly still very uncomfortable with the pitch. Despite the increased usage, Brown throws his changeup in the strike zone only 39.6 percent of the time, but only induces swings on 10.3 percent of those pitches, per FanGraphs. That’s not great, and looking at the heat map for his changeup this year, it’s clear he has no command of it: Now, Ben Brown is down 3-1. Schwarber wasn’t at all fooled by Brown’s best pitch, the curveball. While he did execute a good changeup on the 1-0 pitch, the 2-1 changeup was entirely uncompetitive. His only options now are to try and get the chase with the curveball again and be ok if you end up walking him, or try to breeze a fastball by him. Schwarber knew this, too, and I am fairly certain you already know he was more than ready for it: Ben Brown is clearly working on incorporating a changeup more often. That is a good thing. This plate appearance clearly illustrates the need for it, and how Brown still has a ways to go with his development of it. The curveball won’t always work against good hitters like Schwarber, and if he isn’t comfortable throwing the changeup, hitters know he has to go to the fastball. That’s exactly what happened here, and the Cubs paid the price for it. View full article
-
 Just one week ago, our own Jason Ross broke down a plate appearance that CJ Abrams had against Cade Horton. Jason went pitch-by-pitch, examining what each pitch meant, and what the plate appearance as a whole signified for Horton’s development. I recommend you check that piece out, mostly because it’s a good article, but also because it’s inspired me to write a similar piece about one of Ben Brown’s showdowns against Kyle Schwarber from last week. Specifically, the one where Schwarber launched a home run. Before we jump into the plate appearance, let’s catch you up on where we’re at in the game. The Cubs find themselves in an early 3-0 hole, and the young right-hander is facing the Phillies' order the second time through. The first time he faced Schwarber, he walked him on a full count, throwing five fastballs and one curveball. Now, on to the plate appearance in question, with nobody on and nobody out in the third inning: Not a horrible pitch to start things off with, but also probably not precisely where Brown wanted it. Brown was either trying to sneak a curveball by Schwarber when he was anticipating a fastball for an easy strike one, or he was going for the chase down and out of the zone. The thing is, and Cubs fans are likely familiar with this. Schwarber is a tough player to get a chase from: he has swung at just 20.8 percent of pitches outside of the strike zone, according to FanGraphs. That is 15th lowest in baseball, and for comparison’s sake, the league average is 28 percent. Brown yanking that pitch inside a bit likely eliminated the chance for Schwarber to swing through it. Here’s the next pitch: A changeup, and a beauty at that. You can even see Schwarber give a little nod of approval after taking that pitch for a strike. This is the whole reason I wanted to write this piece to begin with. Since May 19, 7.1 percent of Brown’s pitches thrown have been changeups, per FanGraphs. That might not feel like a lot, but prior to May 19, it was just 2.3 percent, so he has more than tripled his usage of it. He needs a third pitch, and he is, at least, trying to incorporate the changeup more often. That pitch right there is what it looks like when he does so successfully. Now, for the 1-1 pitch: Another curveball, down and out of the zone that the former Cub spits on. Schwarber has now taken two of these pitches, and didn’t look particularly interested in swinging at either one. For someone like Brown, who has historically been a two-pitch pitcher, this puts him in a bind. He’s either not throwing the curveball well enough to get a chase from a guy like Schwarber, or, Schwarber is seeing it really well out of Brown’s hand. Neither is a good sign. According to FanGraphs, Brown is in the zone with his curveball only 43.5 percent of the time, and he gets chases on 40.2 percent of those pitches. He relies on hitters chasing his curveball down and out of the zone, and Schwarber wasn’t biting. This likely left Brown feeling like he couldn’t go to his best pitch. So, what pitch did he throw next? The changeup! Except that this one is incredibly poorly executed, and illustrates that Brown is clearly still very uncomfortable with the pitch. Despite the increased usage, Brown throws his changeup in the strike zone only 39.6 percent of the time, but only induces swings on 10.3 percent of those pitches, per FanGraphs. That’s not great, and looking at the heat map for his changeup this year, it’s clear he has no command of it: Now, Ben Brown is down 3-1. Schwarber wasn’t at all fooled by Brown’s best pitch, the curveball. While he did execute a good changeup on the 1-0 pitch, the 2-1 changeup was entirely uncompetitive. His only options now are to try and get the chase with the curveball again and be ok if you end up walking him, or try to breeze a fastball by him. Schwarber knew this, too, and I am fairly certain you already know he was more than ready for it: Ben Brown is clearly working on incorporating a changeup more often. That is a good thing. This plate appearance clearly illustrates the need for it, and how Brown still has a ways to go with his development of it. The curveball won’t always work against good hitters like Schwarber, and if he isn’t comfortable throwing the changeup, hitters know he has to go to the fastball. That’s exactly what happened here, and the Cubs paid the price for it.
 -
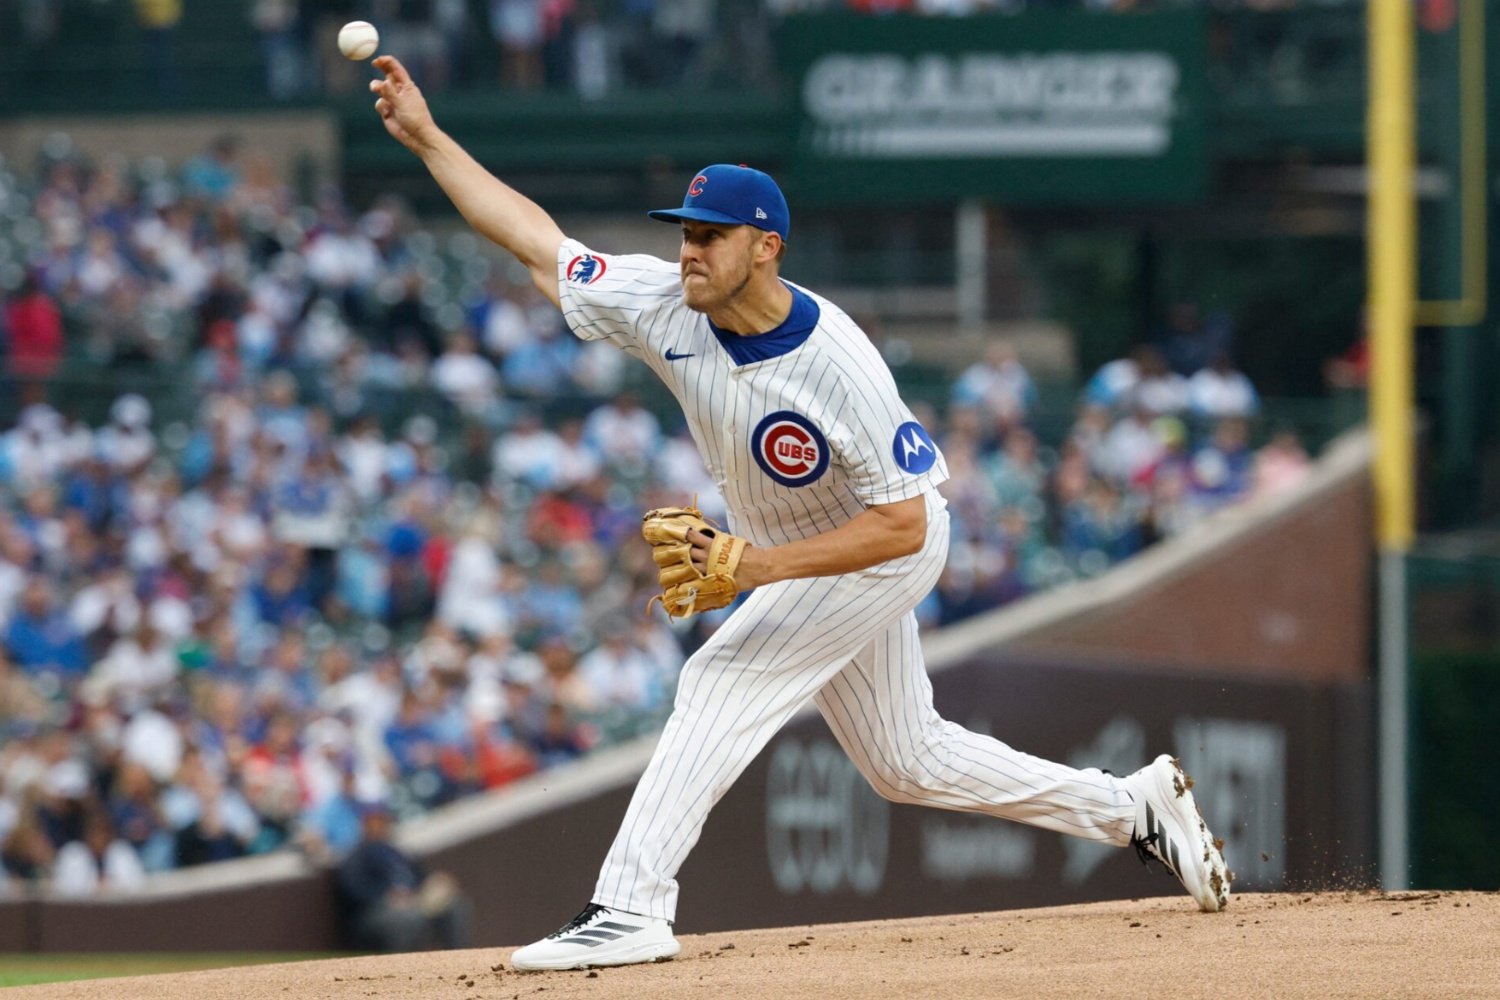 Back in April, I wrote about Jameson Taillon’s kick change, and how it was looking like it was going to be a game-changer for the veteran right-hander in his age-33 season for the Chicago Cubs. At the time, he had just a 6.06 ERA through his first three starts, and was throwing the changeup a meager 5.8 percent of the time. It was clear he wasn’t fully comfortable with the new pitch just yet, but still, he was getting very positive results the few times he was using it, and based on the pitch movement metrics, it was clear that the changeup was different than the one he was throwing in previous seasons. I jotted down when I published that article back in April to follow up on Taillon and his changeup usage later on in the season. Would he continue using it? Would he continue getting such positive results with it? You may already know this if you’ve been paying close attention, but the answer to both of those questions is a loud and resounding yes. If we use the incredibly arbitrary cut off point of Taillon’s May 20 start in Miami, the changeup is now his second most used pitch: it’s been thrown 17.4 percent of the time since then, barely edging out his slider and curveball. He exclusively utilizes it against left-handed hitters, so the heavier usage of late could be due to him facing more lefties, however, it’s clear he’s now much more comfortable throwing his new changeup. It’s hard to argue with the results. According to Baseball Savant, hitters have hit just .195 against Taillon’s changeup. Batters have missed on 38.1 percent of swings they have taken on the pitch, which is the best among all of his pitches. This has allowed the Florida native to neutralize left-handed hitters in a way we just haven’t seen since he has joined the North Siders. As you might recall, an inability to get lefties out was a big reason why he struggled so much in his first season in blue, and while he was better last season, he still wasn’t great at it. All stats courtesy of Fangraphs: Year BA against LHH OBP against LHH SLG against LHH 2023 .266 .340 .514 2024 .254 .303 .428 2025 .179 .225 .375 This is a huge reason for the incredibly successful season that Jameson Taillon is having to this point. From our arbitrary starting point of May 20 and onward, he has a 1.91 ERA, and the Cubs have won all five games that he has pitched. He's been a consistent, quality start machine all year, and his newfound success against opposite-handed hitters is a big reason why. In case you need any more convincing, enjoy this clip of Taillon striking out Riley Greene with his new toy.
 -
Image courtesy of Kamil Krzaczynski-Imagn Images Back in April, I wrote about Jameson Taillon’s kick change, and how it was looking like it was going to be a game-changer for the veteran right-hander in his age-33 season for the Chicago Cubs. At the time, he had just a 6.06 ERA through his first three starts, and was throwing the changeup a meager 5.8 percent of the time. It was clear he wasn’t fully comfortable with the new pitch just yet, but still, he was getting very positive results the few times he was using it, and based on the pitch movement metrics, it was clear that the changeup was different than the one he was throwing in previous seasons. I jotted down when I published that article back in April to follow up on Taillon and his changeup usage later on in the season. Would he continue using it? Would he continue getting such positive results with it? You may already know this if you’ve been paying close attention, but the answer to both of those questions is a loud and resounding yes. If we use the incredibly arbitrary cut off point of Taillon’s May 20 start in Miami, the changeup is now his second most used pitch: it’s been thrown 17.4 percent of the time since then, barely edging out his slider and curveball. He exclusively utilizes it against left-handed hitters, so the heavier usage of late could be due to him facing more lefties, however, it’s clear he’s now much more comfortable throwing his new changeup. It’s hard to argue with the results. According to Baseball Savant, hitters have hit just .195 against Taillon’s changeup. Batters have missed on 38.1 percent of swings they have taken on the pitch, which is the best among all of his pitches. This has allowed the Florida native to neutralize left-handed hitters in a way we just haven’t seen since he has joined the North Siders. As you might recall, an inability to get lefties out was a big reason why he struggled so much in his first season in blue, and while he was better last season, he still wasn’t great at it. All stats courtesy of Fangraphs: Year BA against LHH OBP against LHH SLG against LHH 2023 .266 .340 .514 2024 .254 .303 .428 2025 .179 .225 .375 This is a huge reason for the incredibly successful season that Jameson Taillon is having to this point. From our arbitrary starting point of May 20 and onward, he has a 1.91 ERA, and the Cubs have won all five games that he has pitched. He's been a consistent, quality start machine all year, and his newfound success against opposite-handed hitters is a big reason why. In case you need any more convincing, enjoy this clip of Taillon striking out Riley Greene with his new toy. View full article
-
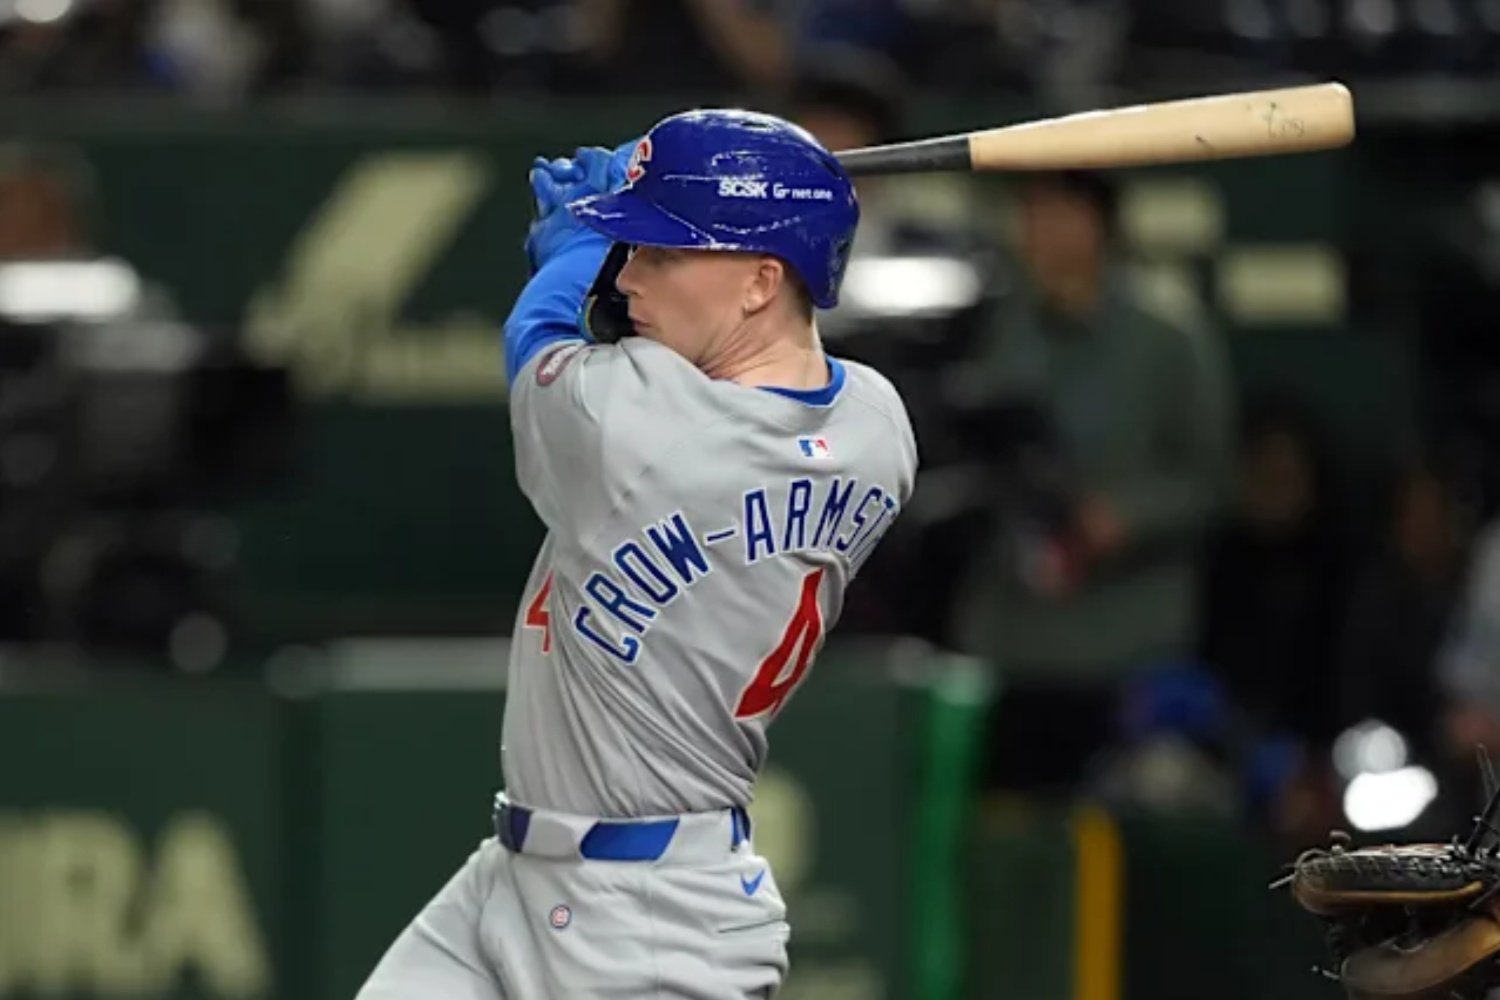 Roughly four years ago, the Chicago Cubs did the unthinkable. By trading away Anthony Rizzo, Kris Bryant, and Javier Baez at the trade deadline, they signaled the end of an era, and the ushering in of a new one. That is to say nothing of the fact that they traded away some fan favorites. Anthony Rizzo felt like the Ernie Banks of this era. Kris Bryant was the best player, and MVP of the whole league, on a World Series-winning team. Javy Baez consistently left fans wondering what kind of incredible feat he would pull off next. Now, we’re more than officially into the new era of Cubs baseball, and I want to talk about the player that Baez was traded for, Pete Crow-Armstrong, who has suddenly developed into the Javier Baez of the new era. Of the many things that Baez was known for, one was swinging at basically anything that came anywhere close to the strike zone. I mean, how often do you see something like this? The crazy thing is, while El Mago most certainly had a propensity for swinging at almost anything, if you look at their individual swing rates, Crow-Armstrong somehow makes Baez look like Juan Soto. Statcast tracks swing rates from 2007 onward, and here are the five highest overall swing rates Cubs players have posted in an individual season since then. O-Swing % is how often a player swings at pitches outside of the strike zone, while Z-Swing % is how often a player swings at pitches inside of the strike zone: Player Year O-Swing % Z-Swing % Swing % Pete Crow-Armstong 2025 45.2% 77.3% 60.9% Javier Baez 2018 42.5% 76.6% 57.8% Alfonso Soriano 2007 43.5% 75.7% 57.4% Javier Baez 2017 41.3% 72.6% 56.1% Alfonso Soriano 2011 43.4% 69.2% 55.4% All in all, this is not horrible company to be in, as Soriano and Baez were both key cogs in some of the most successful Cubs teams this century. The bottom line, though, is that Pete Crow-Armstrong is currently on pace to post the most free swinging season for the Cubs since 2007, when MLB started tracking such metrics. How does this stack up to other players on other teams? Glad you asked! If the season ended today, the young center fielder would have the sixth-highest swing rate since 2007: Player Year O-Swing % Z-Swing % Swing % Ivan Rodriguez 2007 50.1% 75.0% 63.3% Delmon Young 2007 46.5% 80.1% 62.2% Ezequiel Tovar 2024 44.8% 80.3% 62.0% Hanser Alberto 2020 50.4% 74.1% 61.7% Ceddanne Rafaela 2024 46.3% 77.4% 61.5% Pete Crow-Armstrong 2025 45.2% 77.3% 61.5% This, admittedly, is much worse company to keep, and none of these players posted an above-average year at the plate during the seasons in question. Not only is Crow-Armstrong currently having the "swingiest" season in Cubs history, he could potentially have the swingiest season in baseball history. Again, note that this has only been tracked since 2007. Sure, 1.8 percentage points might feel like a lot to make up at this point, but that swing rate has been trending up since around the end of April (graph courtesy of Fangraphs😞 The bad news, and I included it in the graph here, is that pitchers are catching on, and simply starting to throw him way less pitches in the strike zone. That is what the blue line labeled Zone% represents: the percentage of pitches he has seen that were thrown in the strike zone. The good news is that in Saturday’s win over the Reds, the speedy outfielder drew two walks for the first time in his career. They were both on four pitches, and none of those pitches were particularly close to the strike zone, but, hey, baby steps, right? To put a nice little bow on this, Pete Crow-Armstrong is suddenly becoming the Javier Baez for this new era of Cubs baseball, but he has somehow been even more Javier Baez than Javier Baez. Incredible defensive play? Check, and the metrics would say he’s better than Baez. Always up to something on the basepaths? Check, and the metrics would also say he’s a better baserunner. Swinging at everything? Check, and even more so than El Mago ever did. And now, for the ultimate measure: am I now planning bathroom breaks and other periods of time away from the television, around his plate appearances, making sure I always get to see them? Yes I am. Is that for better or for worse? Most of it is for the better. As for the high swing rate stuff, I am not sure! Consider me skeptical that Crow-Armstrong can continue producing offensively at this pace while swinging as often as he has — it's simply not sustainable against major league pitching. Yet somehow, it’s working so far. So, let’s just relax and enjoy the ride.
 -
Image courtesy of Darren Yamashita-Imagn Images Roughly four years ago, the Chicago Cubs did the unthinkable. By trading away Anthony Rizzo, Kris Bryant, and Javier Baez at the trade deadline, they signaled the end of an era, and the ushering in of a new one. That is to say nothing of the fact that they traded away some fan favorites. Anthony Rizzo felt like the Ernie Banks of this era. Kris Bryant was the best player, and MVP of the whole league, on a World Series-winning team. Javy Baez consistently left fans wondering what kind of incredible feat he would pull off next. Now, we’re more than officially into the new era of Cubs baseball, and I want to talk about the player that Baez was traded for, Pete Crow-Armstrong, who has suddenly developed into the Javier Baez of the new era. Of the many things that Baez was known for, one was swinging at basically anything that came anywhere close to the strike zone. I mean, how often do you see something like this? The crazy thing is, while El Mago most certainly had a propensity for swinging at almost anything, if you look at their individual swing rates, Crow-Armstrong somehow makes Baez look like Juan Soto. Statcast tracks swing rates from 2007 onward, and here are the five highest overall swing rates Cubs players have posted in an individual season since then. O-Swing % is how often a player swings at pitches outside of the strike zone, while Z-Swing % is how often a player swings at pitches inside of the strike zone: Player Year O-Swing % Z-Swing % Swing % Pete Crow-Armstong 2025 45.2% 77.3% 60.9% Javier Baez 2018 42.5% 76.6% 57.8% Alfonso Soriano 2007 43.5% 75.7% 57.4% Javier Baez 2017 41.3% 72.6% 56.1% Alfonso Soriano 2011 43.4% 69.2% 55.4% All in all, this is not horrible company to be in, as Soriano and Baez were both key cogs in some of the most successful Cubs teams this century. The bottom line, though, is that Pete Crow-Armstrong is currently on pace to post the most free swinging season for the Cubs since 2007, when MLB started tracking such metrics. How does this stack up to other players on other teams? Glad you asked! If the season ended today, the young center fielder would have the sixth-highest swing rate since 2007: Player Year O-Swing % Z-Swing % Swing % Ivan Rodriguez 2007 50.1% 75.0% 63.3% Delmon Young 2007 46.5% 80.1% 62.2% Ezequiel Tovar 2024 44.8% 80.3% 62.0% Hanser Alberto 2020 50.4% 74.1% 61.7% Ceddanne Rafaela 2024 46.3% 77.4% 61.5% Pete Crow-Armstrong 2025 45.2% 77.3% 61.5% This, admittedly, is much worse company to keep, and none of these players posted an above-average year at the plate during the seasons in question. Not only is Crow-Armstrong currently having the "swingiest" season in Cubs history, he could potentially have the swingiest season in baseball history. Again, note that this has only been tracked since 2007. Sure, 1.8 percentage points might feel like a lot to make up at this point, but that swing rate has been trending up since around the end of April (graph courtesy of Fangraphs😞 The bad news, and I included it in the graph here, is that pitchers are catching on, and simply starting to throw him way less pitches in the strike zone. That is what the blue line labeled Zone% represents: the percentage of pitches he has seen that were thrown in the strike zone. The good news is that in Saturday’s win over the Reds, the speedy outfielder drew two walks for the first time in his career. They were both on four pitches, and none of those pitches were particularly close to the strike zone, but, hey, baby steps, right? To put a nice little bow on this, Pete Crow-Armstrong is suddenly becoming the Javier Baez for this new era of Cubs baseball, but he has somehow been even more Javier Baez than Javier Baez. Incredible defensive play? Check, and the metrics would say he’s better than Baez. Always up to something on the basepaths? Check, and the metrics would also say he’s a better baserunner. Swinging at everything? Check, and even more so than El Mago ever did. And now, for the ultimate measure: am I now planning bathroom breaks and other periods of time away from the television, around his plate appearances, making sure I always get to see them? Yes I am. Is that for better or for worse? Most of it is for the better. As for the high swing rate stuff, I am not sure! Consider me skeptical that Crow-Armstrong can continue producing offensively at this pace while swinging as often as he has — it's simply not sustainable against major league pitching. Yet somehow, it’s working so far. So, let’s just relax and enjoy the ride. View full article
-
I do think that bunting could be a legitimate part of his game. It needs to be applied in better situations than this, though. Which I know you’re agreeing with anyway. A couple of points on him bunting, in general: 1. He has laid down eight total bunts this season, but three of those went for sacrifices. So technically a few more than five, but only five count against his batting average. 2. If it is going to be a legitimate part of his game, he needs to be better at it. Even if he maintains the .400 batting average, that would put him in a three way tie for 10th out of 15 hitters who have laid down at least five bunts. The league as a whole is hitting .514 on bunts.
-
Thanks! Personally, I’d tend to chalk up Nico’s RISP batting average as sample size that would average out over time. However, I had no idea he was hitting that well with RISP, and you make fair points!
-
Image courtesy of © Katie Stratman-USA TODAY Sports Last Wednesday, with two on, two out, and the Cubs trailing by two in the bottom of the sixth, Pete Crow-Armstrong stepped to the plate. This was a fantastic opportunity for the North Siders, who were going for the sweep against the Miami Marlins, to scratch a few runs across the board and get back in the ballgame. Except that Crow-Armstrong, who, through Saturday’s games, has been the 19th best qualified hitter in baseball by wRC+, bunted. He did succeed in doing so, despite it being a terrible bunt, thus loading the bases for Nico Hoerner. For what it’s worth, and you likely already know this, Nico Hoerner struck out to end the inning, and the Cubs went on to lose the game, 3-1. The end result is somewhat irrelevant. Hoerner could have hit a grand slam there, and I’d probably still be writing this article. For me, the ends don’t always justify the means. In this case, they did. I am here to talk about one of the Cubs’ best hitters deciding to bunt with two on and two out while down two runs. I have been here before with the young center fielder. On August 1 of last year, I wrote an article pleading with him to stop bunting so much. Through that point of last season, Crow-Armstrong was hitting just .222 on 13 bunt attempts, which was the worst mark in baseball of anyone that had put down at least 10 bunts. He has been considerably better since. He had a .625 batting average on bunts in August and September of last season, according to Baseball Savant. He also had four sacrifice bunts, which of course, don’t count against his batting average. I’m not sure it’s fair to ever give Crow-Armstrong a sacrifice bunt, because every bunt he lays down is an attempt at a hit. If it ends up as a sacrifice, that is simply a positive consequence. That being said, I’ll be nice and not knock him for it. This year, he’s hitting .400 on five bunt attempts, with three sacrifices. Hooray! I would have been thrilled with that last season. Now, I'm not, mostly because Crow-Armstrong is a good hitter these days. A flawed one, sure, but the current results can’t be argued with. Back to Tuesday night’s decision to bunt. In deciding to bunt, he took away any chance that he had to drive in a run. The best-case scenario that he created for himself was for the Cubs to end up with the bases loaded and two outs. Using the Win Probability Added (WPA) Inquirer at FanGraphs, we can calculate the average WPA that Crow-Armstrong was providing by bunting, or by swinging away. For example, if he bunts, we can assume that would result in a single 40 percent of the time, and an out 60 percent of the time, since he is hitting .400 on bunts this season. The Cubs would go from a 24.7 percent chance of winning with runners on first and second with two outs, to a 29.9 percent chance of winning with the bases loaded and two outs, a 5.2 percent difference. He has a 40 percent chance of creating that 5.2 percent difference, so if we multiply those two together, we get 2.1 percent. But he also has a 60 percent chance of making an out, and in this case, an out would drop the Cubs’ win probability by 6.6 percent. Multiply those together, and we get -4 percent. If we subtract that from our first number, we get -1.9 percent. This means that, with Pete Crow-Armstrong squaring to bunt in that situation, he is subtracting 1.9 percent from the Cubs’ win probability, on average. Now, let’s run that same calculation, for this particular scenario, based on his full season statistics. Let’s also assume a single scores one run, and a double scores two: Event % chance of happening WPA added or lost Average WPA added or lost Single 13.51% 13.4% 1.8% Double 5.95% 30.6% 1.8% Triple 0.54% 31.4% 0.2% HR 6.49% 45.9% 3% BB/HBP 5.41% 5.2% 0.3% Out 68.11% 6.6% -4.5% Total 2.6% Adding all of that up, and we can see that an average plate appearance from Pete Crow-Armstrong in that situation would result in 2.6 percentage points of win probability added. A much better figure than the average bunt, which as we saw above, would result in a 1.9 percentage point loss in win probability. Is this logic perfect? No, and I can mention the variables that this does not address, some of which support the bunt, and some of which do not: The next batter was Nico Hoerner, who is a decent player and has been a roughly league average hitter for several seasons now. He is also one of the Cubs’ worst hitters. It’s not like Kyle Tucker was due next. A single will not always score one run, and a double will not always score two. The pitcher was Calvin Faucher, an above-average relief arm. Perhaps Crow-Armstrong didn’t like the matchup. There is some very small chance that the Marlins throw that ball down the right field line and the Cubs score two runs on the bunt, especially given the weather conditions at the time. I am assuming there is a zero percent chance of that happening in the above calculations. I don’t think any of that is bridging the gap between average WPA on a bunt vs. swinging away, though. Ironically enough, Pete Crow-Armstrong stepped to the plate with two on and two outs in a tie game on Friday afternoon against the White Sox. He swung away, and deposited the ball into the right field bleachers, giving the Cubs a 5-2 lead that they would never look back from, adding 26% to the Cubs’ win probability. Hopefully he learned his lesson. Pete Crow-Armstrong is just a good hitter now. Period. He’d do well to remember that. View full article
-
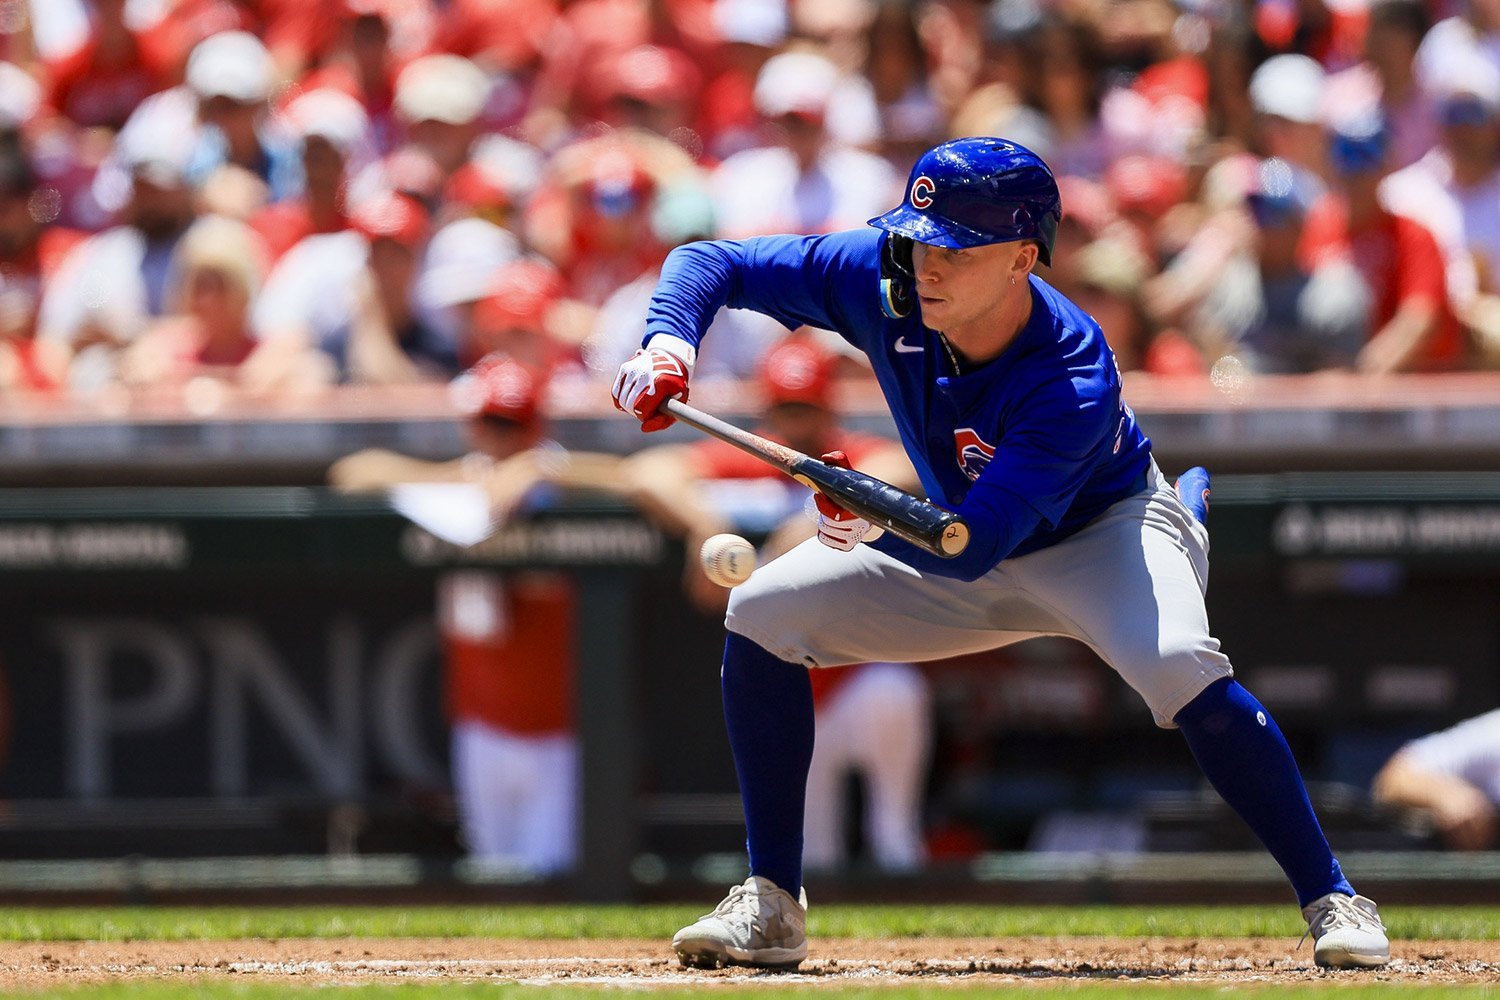 Last Wednesday, with two on, two out, and the Cubs trailing by two in the bottom of the sixth, Pete Crow-Armstrong stepped to the plate. This was a fantastic opportunity for the North Siders, who were going for the sweep against the Miami Marlins, to scratch a few runs across the board and get back in the ballgame. Except that Crow-Armstrong, who, through Saturday’s games, has been the 19th best qualified hitter in baseball by wRC+, bunted. He did succeed in doing so, despite it being a terrible bunt, thus loading the bases for Nico Hoerner. For what it’s worth, and you likely already know this, Nico Hoerner struck out to end the inning, and the Cubs went on to lose the game, 3-1. The end result is somewhat irrelevant. Hoerner could have hit a grand slam there, and I’d probably still be writing this article. For me, the ends don’t always justify the means. In this case, they did. I am here to talk about one of the Cubs’ best hitters deciding to bunt with two on and two out while down two runs. I have been here before with the young center fielder. On August 1 of last year, I wrote an article pleading with him to stop bunting so much. Through that point of last season, Crow-Armstrong was hitting just .222 on 13 bunt attempts, which was the worst mark in baseball of anyone that had put down at least 10 bunts. He has been considerably better since. He had a .625 batting average on bunts in August and September of last season, according to Baseball Savant. He also had four sacrifice bunts, which of course, don’t count against his batting average. I’m not sure it’s fair to ever give Crow-Armstrong a sacrifice bunt, because every bunt he lays down is an attempt at a hit. If it ends up as a sacrifice, that is simply a positive consequence. That being said, I’ll be nice and not knock him for it. This year, he’s hitting .400 on five bunt attempts, with three sacrifices. Hooray! I would have been thrilled with that last season. Now, I'm not, mostly because Crow-Armstrong is a good hitter these days. A flawed one, sure, but the current results can’t be argued with. Back to Tuesday night’s decision to bunt. In deciding to bunt, he took away any chance that he had to drive in a run. The best-case scenario that he created for himself was for the Cubs to end up with the bases loaded and two outs. Using the Win Probability Added (WPA) Inquirer at FanGraphs, we can calculate the average WPA that Crow-Armstrong was providing by bunting, or by swinging away. For example, if he bunts, we can assume that would result in a single 40 percent of the time, and an out 60 percent of the time, since he is hitting .400 on bunts this season. The Cubs would go from a 24.7 percent chance of winning with runners on first and second with two outs, to a 29.9 percent chance of winning with the bases loaded and two outs, a 5.2 percent difference. He has a 40 percent chance of creating that 5.2 percent difference, so if we multiply those two together, we get 2.1 percent. But he also has a 60 percent chance of making an out, and in this case, an out would drop the Cubs’ win probability by 6.6 percent. Multiply those together, and we get -4 percent. If we subtract that from our first number, we get -1.9 percent. This means that, with Pete Crow-Armstrong squaring to bunt in that situation, he is subtracting 1.9 percent from the Cubs’ win probability, on average. Now, let’s run that same calculation, for this particular scenario, based on his full season statistics. Let’s also assume a single scores one run, and a double scores two: Event % chance of happening WPA added or lost Average WPA added or lost Single 13.51% 13.4% 1.8% Double 5.95% 30.6% 1.8% Triple 0.54% 31.4% 0.2% HR 6.49% 45.9% 3% BB/HBP 5.41% 5.2% 0.3% Out 68.11% 6.6% -4.5% Total 2.6% Adding all of that up, and we can see that an average plate appearance from Pete Crow-Armstrong in that situation would result in 2.6 percentage points of win probability added. A much better figure than the average bunt, which as we saw above, would result in a 1.9 percentage point loss in win probability. Is this logic perfect? No, and I can mention the variables that this does not address, some of which support the bunt, and some of which do not: The next batter was Nico Hoerner, who is a decent player and has been a roughly league average hitter for several seasons now. He is also one of the Cubs’ worst hitters. It’s not like Kyle Tucker was due next. A single will not always score one run, and a double will not always score two. The pitcher was Calvin Faucher, an above-average relief arm. Perhaps Crow-Armstrong didn’t like the matchup. There is some very small chance that the Marlins throw that ball down the right field line and the Cubs score two runs on the bunt, especially given the weather conditions at the time. I am assuming there is a zero percent chance of that happening in the above calculations. I don’t think any of that is bridging the gap between average WPA on a bunt vs. swinging away, though. Ironically enough, Pete Crow-Armstrong stepped to the plate with two on and two outs in a tie game on Friday afternoon against the White Sox. He swung away, and deposited the ball into the right field bleachers, giving the Cubs a 5-2 lead that they would never look back from, adding 26% to the Cubs’ win probability. Hopefully he learned his lesson. Pete Crow-Armstrong is just a good hitter now. Period. He’d do well to remember that.
 -
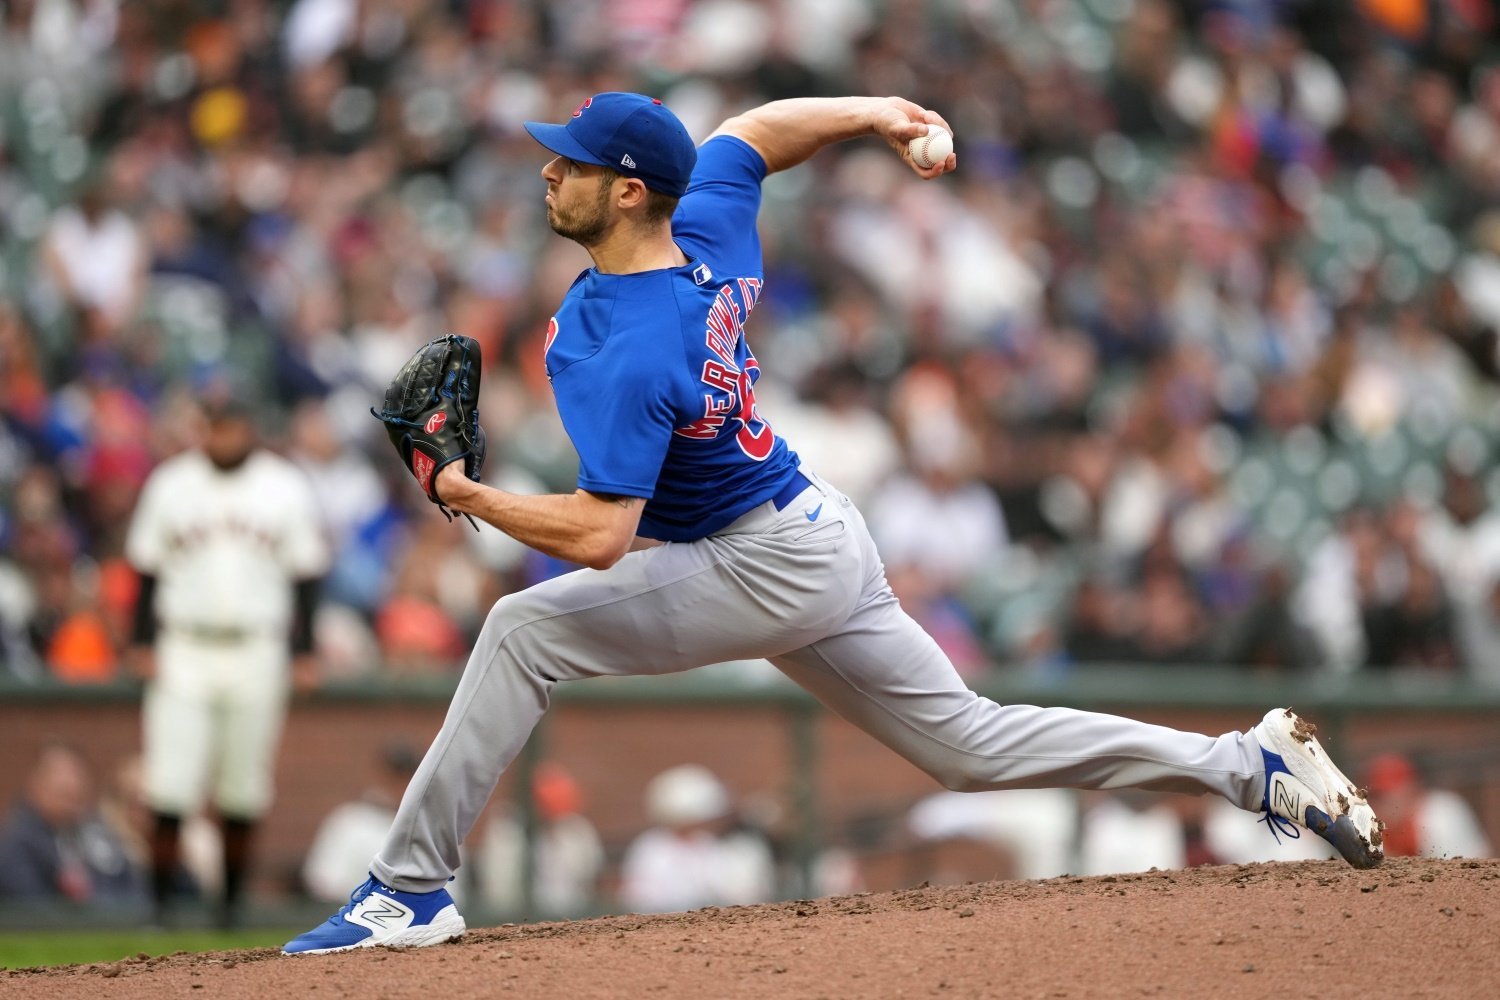 It was just two seasons ago when Julian Merryweather was arguably the most valuable relief pitcher on the Cubs. After an injury marred 2024 season, his performance in 2025 has been subpar, to say the least. His more recent struggles came to a head this past week, when he posted back-to-back two-run outings against the Mets and Marlins. Is there any reason for fans to panic about the veteran right-hander? In short, yes. Entering Saturday’s action, Merryweather’s 4.76 ERA is actually better than his 5.20 xERA, and right on par with his 4.75 FIP. Both of those numbers would suggest that he has been as bad as his ERA would indicate. Let’s take this one step further. Why has his performance suffered? The first and most obvious place to look is in his strikeout rate. In the 2023 season, Merryweather struck out 32.3 percent of the hitters he faced, which was 16th in baseball among 162 qualified relievers, according to FanGraphs. This year, his strikeout rate has plummeted to 18.2 percent, which is 147th out of 188 qualified relievers. Merryweather succeeded in 2023 with a simple approach. He had two plus-pitches, a four-seam fastball and a slider, that he was capable of throwing in any count, in any situation. The fastball at the top of the zone tunneled well with the slider at the bottom of the zone. With the fastball averaging 98.1 mph two seasons ago, you had to be ready for that while also protecting against the slider, thus creating swing and miss with the breaking ball. Here’s his performance on each pitch from the 2023 season, compared to this season, and I trust you can spot the differences. All stats courtesy of FanGraphs: Velocity (mph) wRC+ O-Swing% SwStr% 2023 Fastball 98.1 132 21.8% 8.2% 2025 Fastball 96.0 170 20.7% 3.4% 2023 Slider 86.9 60 37.2% 20.2% 2025 Slider 84.6 54 28.7% 10.9% Hitters still, mostly, can’t hit the slider well. They’re just chasing less, and as a result, swinging and missing at it a whole lot less. This is probably due to the two mph decline in velocity across the board. Hitters have a fraction of a second more to decide if the pitch is a slider or a fastball out of Merryweather’s hand, and that fraction of a second is making all the difference. Within that vein, I have good and bad news. His velocity has been slowly declining all season, with both his fastball (94.8 mph) and slider (83.7 mph) velocity hitting a season low in his outing against the Marlins last Tuesday. Frankly, I expected we’d see an injury list placement after that, but instead we have good news: he rebounded to average a season high 97.2 mph on the fastball in his scoreless outing against the White Sox on Friday: In 2019, Driveline Baseball found that adding one mph to a player’s fastball velocity could be worth as much as .25-.35 in WAR in one season. In 2023, Julian Merryweather was worth 0.8 WAR on FanGraphs. Applying this logic, him losing two mph on his fastball might cost him just about all of his value, and that sure is what it feels like at this point. For now, let’s hope that the added velocity in his most recent appearance is a sign of more things to come. Otherwise, there might not be much good weather on the North Side when Julian Merryweather comes into the game.
 -
Image courtesy of © Darren Yamashita-USA TODAY Sports It was just two seasons ago when Julian Merryweather was arguably the most valuable relief pitcher on the Cubs. After an injury marred 2024 season, his performance in 2025 has been subpar, to say the least. His more recent struggles came to a head this past week, when he posted back-to-back two-run outings against the Mets and Marlins. Is there any reason for fans to panic about the veteran right-hander? In short, yes. Entering Saturday’s action, Merryweather’s 4.76 ERA is actually better than his 5.20 xERA, and right on par with his 4.75 FIP. Both of those numbers would suggest that he has been as bad as his ERA would indicate. Let’s take this one step further. Why has his performance suffered? The first and most obvious place to look is in his strikeout rate. In the 2023 season, Merryweather struck out 32.3 percent of the hitters he faced, which was 16th in baseball among 162 qualified relievers, according to FanGraphs. This year, his strikeout rate has plummeted to 18.2 percent, which is 147th out of 188 qualified relievers. Merryweather succeeded in 2023 with a simple approach. He had two plus-pitches, a four-seam fastball and a slider, that he was capable of throwing in any count, in any situation. The fastball at the top of the zone tunneled well with the slider at the bottom of the zone. With the fastball averaging 98.1 mph two seasons ago, you had to be ready for that while also protecting against the slider, thus creating swing and miss with the breaking ball. Here’s his performance on each pitch from the 2023 season, compared to this season, and I trust you can spot the differences. All stats courtesy of FanGraphs: Velocity (mph) wRC+ O-Swing% SwStr% 2023 Fastball 98.1 132 21.8% 8.2% 2025 Fastball 96.0 170 20.7% 3.4% 2023 Slider 86.9 60 37.2% 20.2% 2025 Slider 84.6 54 28.7% 10.9% Hitters still, mostly, can’t hit the slider well. They’re just chasing less, and as a result, swinging and missing at it a whole lot less. This is probably due to the two mph decline in velocity across the board. Hitters have a fraction of a second more to decide if the pitch is a slider or a fastball out of Merryweather’s hand, and that fraction of a second is making all the difference. Within that vein, I have good and bad news. His velocity has been slowly declining all season, with both his fastball (94.8 mph) and slider (83.7 mph) velocity hitting a season low in his outing against the Marlins last Tuesday. Frankly, I expected we’d see an injury list placement after that, but instead we have good news: he rebounded to average a season high 97.2 mph on the fastball in his scoreless outing against the White Sox on Friday: In 2019, Driveline Baseball found that adding one mph to a player’s fastball velocity could be worth as much as .25-.35 in WAR in one season. In 2023, Julian Merryweather was worth 0.8 WAR on FanGraphs. Applying this logic, him losing two mph on his fastball might cost him just about all of his value, and that sure is what it feels like at this point. For now, let’s hope that the added velocity in his most recent appearance is a sign of more things to come. Otherwise, there might not be much good weather on the North Side when Julian Merryweather comes into the game. View full article
-
Image courtesy of © David Banks-USA TODAY Sports In case you missed it, last week I took a look at the historic start to the season that the Chicago Cubs have had on the bases. If you haven’t read that yet, I recommend doing so. In summary, they very well could break the modern franchise record for stolen bases in a season, and by FanGraphs’ Baserunning Runs (BsR) statistic, they are on pace to be one of the best baserunning teams of all time. Originally, I intended to take a look at Pete Crow-Armstrong’s production on the bases within my article last week. Turns out, I had so much more to say about him that I didn’t even think I could fit it all into one article. Let’s start with the most obvious stat, again: stolen bases. With 12 stolen bases in 33 games, the young outfielder is on pace for 59 stolen bases on the season. No Cub has stolen more than 58 bases since Billy Maloney in 1905. The most any Cub has had in a single season in franchise history is 84 by Bill Lange in 1896. Juan Pierre stole 58 bases for the Cubs in 2006, which is the most for the Cubs in a single season in modern history. That’s the real number that PCA is chasing here. That said, I’m not taking 84 off the table for him. Now, let’s look at BsR. Crow-Armstrong leads baseball with 2.8 BsR, just a hair above Byron Buxton, who sits at 2.7. This puts him on pace for about 13.75 BsR for the season. As a reminder, FanGraphs does not recommend looking at BsR prior to 2002. The highest single season mark since then was Mike Trout, who had 14.3 BsR in 2012. The highest for a Cub? Pierre, again, with 8.0 BsR in 2006. History is well within reach here as well. Baseball Savant breaks a baserunners value down a bit further. For what it’s worth, they actually rate PCA as the third most valuable runner in baseball this season, with Corbin Carroll and the aforementioned Buxton ranking ahead of him. Specifically, he’s been worth two runs via stolen base attempts, which is third in baseball, and one run via extra bases taken, which is 12th. This is the part where I tell you that PCA could be even better. There’s a case to be made that he should be even more aggressive than he has been. He’s only been caught stealing once, a paltry figure juxtaposed against those 12 successful attempts. In addition to that, he sits in 12th in runs via extra bases taken partially because he has only attempted to take an extra base seven percent of the time more than the average player. Corbin Carroll, who leads baseball with two runs gained via extra bases taken, is at 23 percent. It should be noted, this is all circumstantial, and to a degree, based on the opportunities that you get. For example, in this particular play, he accrued -0.19 runs for holding at third. Not only was this a tough read, but with no outs and the bases loaded, this was probably the right decision. He ended up scoring on an Ian Happ sacrifice fly, anyway. To wrap up two straight weekends of me throwing a whole bunch of numbers at you: the Cubs are a really good baserunning team. If they continue at their current pace, they very well could end up being one of the best baserunning teams not just in franchise history, but potentially baseball history, too. Pete Crow-Armstrong is, of course, at the forefront of this success. If he continues at his current pace, he would also have one of the best baserunning seasons in both franchise and baseball history. The team and PCA may or may not continue this pace, but I am at least looking forward to watching this unfold the rest of the season. View full article
-
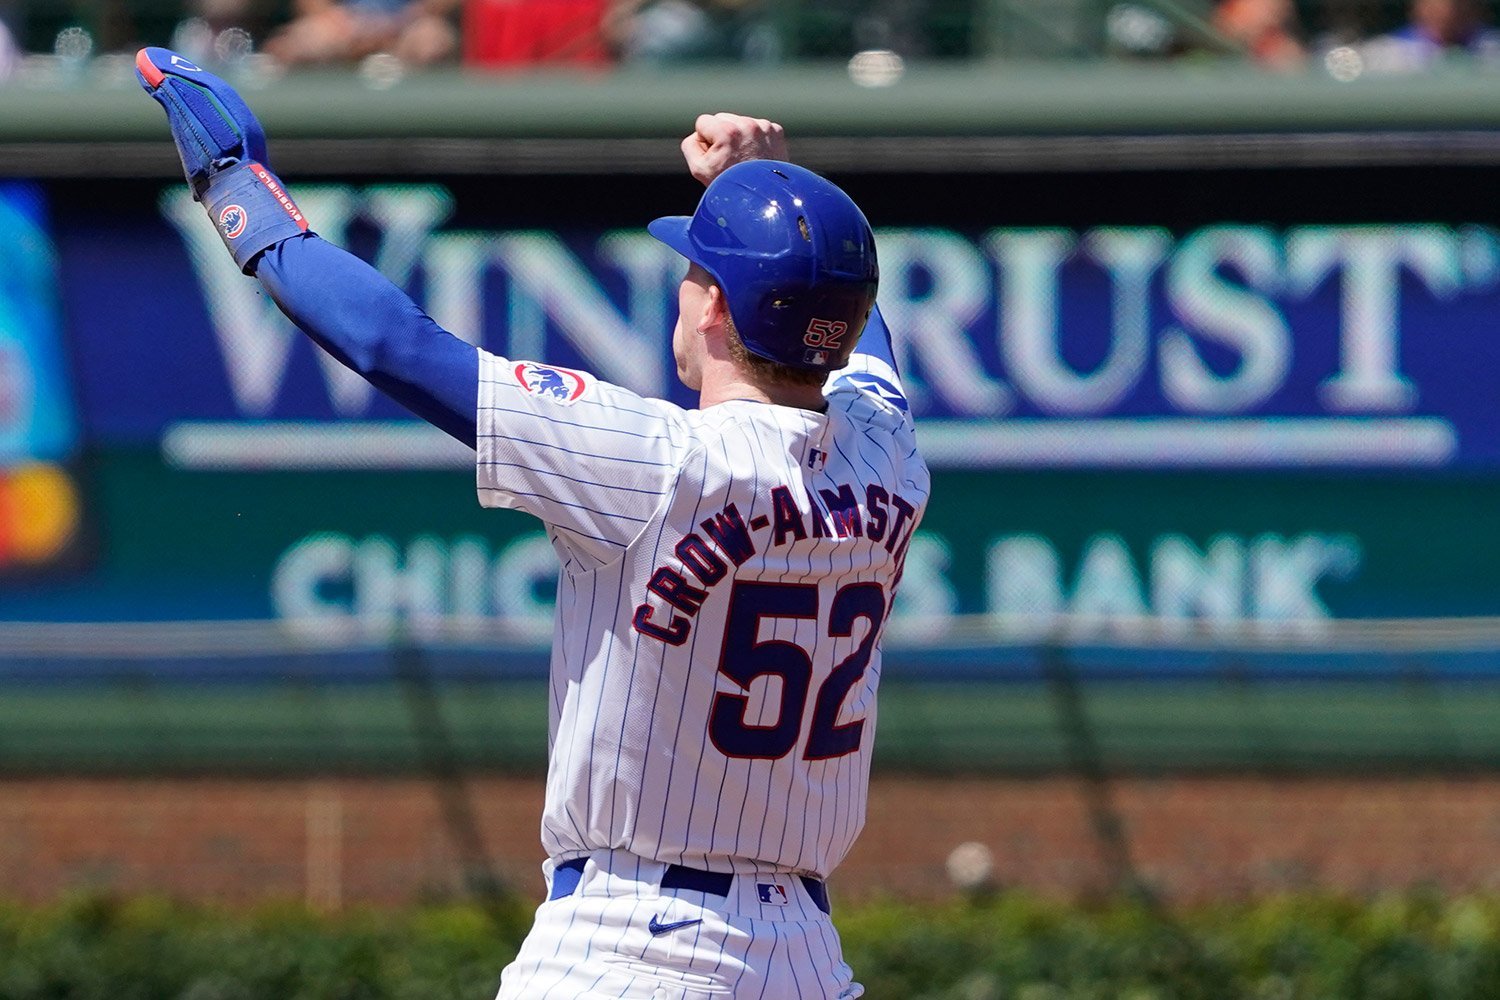 In case you missed it, last week I took a look at the historic start to the season that the Chicago Cubs have had on the bases. If you haven’t read that yet, I recommend doing so. In summary, they very well could break the modern franchise record for stolen bases in a season, and by FanGraphs’ Baserunning Runs (BsR) statistic, they are on pace to be one of the best baserunning teams of all time. Originally, I intended to take a look at Pete Crow-Armstrong’s production on the bases within my article last week. Turns out, I had so much more to say about him that I didn’t even think I could fit it all into one article. Let’s start with the most obvious stat, again: stolen bases. With 12 stolen bases in 33 games, the young outfielder is on pace for 59 stolen bases on the season. No Cub has stolen more than 58 bases since Billy Maloney in 1905. The most any Cub has had in a single season in franchise history is 84 by Bill Lange in 1896. Juan Pierre stole 58 bases for the Cubs in 2006, which is the most for the Cubs in a single season in modern history. That’s the real number that PCA is chasing here. That said, I’m not taking 84 off the table for him. Now, let’s look at BsR. Crow-Armstrong leads baseball with 2.8 BsR, just a hair above Byron Buxton, who sits at 2.7. This puts him on pace for about 13.75 BsR for the season. As a reminder, FanGraphs does not recommend looking at BsR prior to 2002. The highest single season mark since then was Mike Trout, who had 14.3 BsR in 2012. The highest for a Cub? Pierre, again, with 8.0 BsR in 2006. History is well within reach here as well. Baseball Savant breaks a baserunners value down a bit further. For what it’s worth, they actually rate PCA as the third most valuable runner in baseball this season, with Corbin Carroll and the aforementioned Buxton ranking ahead of him. Specifically, he’s been worth two runs via stolen base attempts, which is third in baseball, and one run via extra bases taken, which is 12th. This is the part where I tell you that PCA could be even better. There’s a case to be made that he should be even more aggressive than he has been. He’s only been caught stealing once, a paltry figure juxtaposed against those 12 successful attempts. In addition to that, he sits in 12th in runs via extra bases taken partially because he has only attempted to take an extra base seven percent of the time more than the average player. Corbin Carroll, who leads baseball with two runs gained via extra bases taken, is at 23 percent. It should be noted, this is all circumstantial, and to a degree, based on the opportunities that you get. For example, in this particular play, he accrued -0.19 runs for holding at third. Not only was this a tough read, but with no outs and the bases loaded, this was probably the right decision. He ended up scoring on an Ian Happ sacrifice fly, anyway. To wrap up two straight weekends of me throwing a whole bunch of numbers at you: the Cubs are a really good baserunning team. If they continue at their current pace, they very well could end up being one of the best baserunning teams not just in franchise history, but potentially baseball history, too. Pete Crow-Armstrong is, of course, at the forefront of this success. If he continues at his current pace, he would also have one of the best baserunning seasons in both franchise and baseball history. The team and PCA may or may not continue this pace, but I am at least looking forward to watching this unfold the rest of the season.


