

matto1233
-
Posts
321 -
Joined
-
Last visited
2 Followers


matto1233's Achievements
")


-
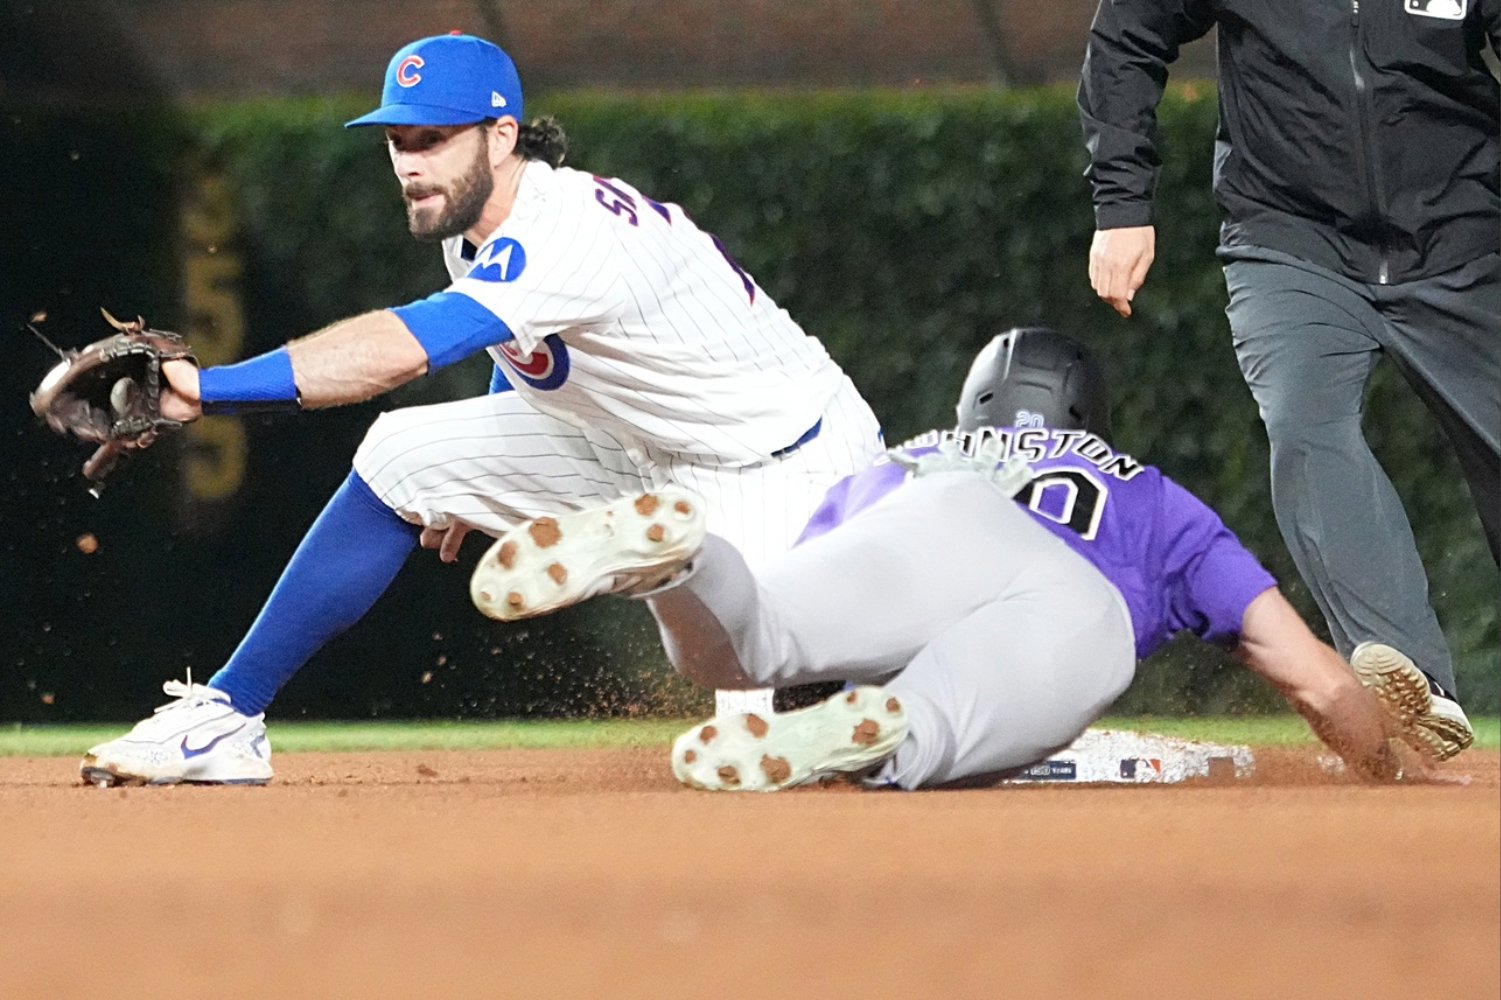
Image courtesy of © Michael McLoone-Imagn Images Let’s take ourselves back to October of 2025. The Chicago Cubs, facing a winner-take-all Game 5 against the Milwaukee Brewers, sent Drew Pomeranz to the mound to open the game. One swing from William Contreras later, and the Brewers led 1-0 before the first inning had even ended. Unfortunately, despite the poor result, Pomeranz was probably the best option that they had. Matthew Boyd couldn't be trusted after he failed to complete the first inning in a Game 1 loss. They couldn’t trust Shota Imanaga after he gave up four runs in less than three innings in Game 2. The cupboard was bare. So after Pomeranz, they turned to Colin Rea. While he maintains his status as a decent and useful arm, Rea is not someone any team should be turning to in a tie game in the playoffs. He performed admirably before eventually giving up a home run to Andrew Vaughn to make it 2-1 Brewers, who went on to win the game 3-1. Running out of pitching in the final game of the NLDS is a precarious place to be, especially when you consider that the Los Angeles Dodgers were waiting on the other side of that Game 5. The root of the issue is traced all the way back to the trade deadline, when Jed Hoyer knew his team needed pitching, and all he came away with was Michael Soroka, Taylor Rogers, and Andrew Kittredge. Our @Jeremy Tecktiel recently revisited the 2025 deadline here, so we won’t get too in-depth in this piece. In case you’ve forgotten, though, let me jog your memory: the Cubs sorely needed pitchers to help out an offense that was one of the best in baseball. The Cubs then acquired the three guys above, and none of those guys made a huge impact. Soroka got hurt in his first start as a Cub, returning in time to give up three runs in one inning of postseason work. Rogers made little impact and threw just one, low-leverage postseason inning. And while Kittredge was key to beating the San Diego Padres in the Wild Card round, he only threw 2.2 innings. One impactful bullpen arm was not enough. You might argue that it’s hard to pin the Game 5 loss on the pitching, given that the offense only came through with one run that game. That’s fair, though I am here to say that Jed Hoyer never even gave the offense a chance. After Michael Busch got the Cubs off to an early 1-0 lead with a lead-off home run in Game 1, Boyd promptly surrendered six runs in the bottom half of the first. After Seiya Suzuki spotted the Cubs to a 3-0 lead in Game 2, Shota Imanaga immediately gave that lead back by allowing a three-run home run to Andrew Vaughn. The offense failed to come through, sure, but that offense was good enough to do damage in the playoffs. The fact of the matter is that they never had a chance to win the World Series, or even the Division Series, because of the pitching. And that is because Jed Hoyer failed to appropriately supplement his team at the trade deadline. Now here the Cubs sit in 2026 in the exact same situation. They have a top five offense by almost any measure. Their pitching, on the other hand, sports a 4.19 ERA, which is 15th in baseball. Frankly, that number is propped up by an elite defense. FIP, which is a stat that attempts to isolate what a pitcher can truly control, rates this Cubs staff as 25th in baseball. FanGraphs WAR rates them at 27th. Their strikeout rate, despite Hoyer constantly saying they were going to work hard to increase that in the offseason, is 22nd. The 2025 trade deadline was a failure. The 2026 trade deadline has to be better. I am not saying that the Cubs need to go get Tarik Skubal. Even two mid-tier starting pitchers would help this team immensely, because right now, the North Siders probably only have two starters that should even be sniffing a postseason mound. Boyd is a good pitcher, but should probably be starting Game 3 or 4 of a playoff series, not the opener, as he likely would for the Cubs right now. Ditto for Imanaga, who gives up way too many home runs to be trusted in October (as we saw last year). The options after that get bleak fast. Jameson Taillon has been worth -0.8 fWAR, one of the lowest figures in baseball. Colin Rea should not be on a postseason mound. David Peterson has been good in three of his four starts in a Cubs uniform, but in the other one, he gave up 10 runs. I wouldn’t guarantee that Edward Cabrera or Ben Brown will be making a huge impact here, either. What about the bullpen? Some guys have had some flashes, sure, but in July so far they have posted an unsightly 4.69 ERA. Who are we supposed to trust out of that group? With this cobbled-together pitching staff, the Cubs still have an 87.1 percent chance to make the playoffs, and a 4.2 percent chance of winning the World Series, per FanGraphs’ playoff odds. Just imagine what they could do with a couple of extra competent pitchers on the staff? Last season, Hoyer failed to go out and get those pitchers. Reportedly, the lockout scared him away, and those fears will be heightened this year. But this team won't go further than they did last year if fear controls the front office's thinking over the next week. View full article
-
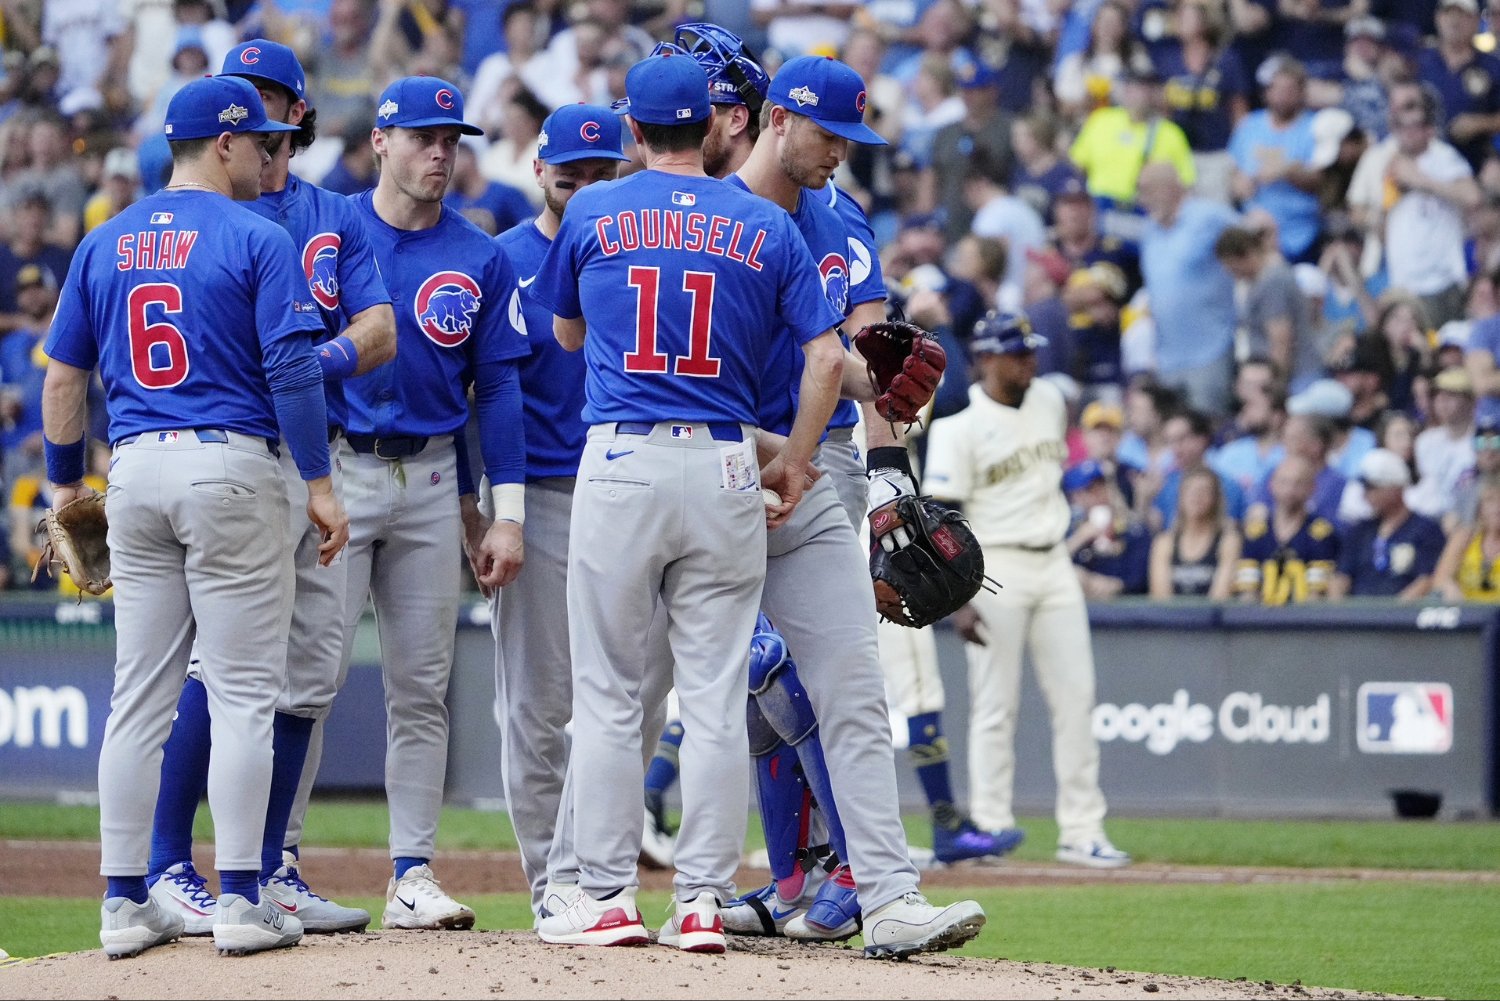 Let’s take ourselves back to October of 2025. The Chicago Cubs, facing a winner-take-all Game 5 against the Milwaukee Brewers, sent Drew Pomeranz to the mound to open the game. One swing from William Contreras later, and the Brewers led 1-0 before the first inning had even ended. Unfortunately, despite the poor result, Pomeranz was probably the best option that they had. Matthew Boyd couldn't be trusted after he failed to complete the first inning in a Game 1 loss. They couldn’t trust Shota Imanaga after he gave up four runs in less than three innings in Game 2. The cupboard was bare. So after Pomeranz, they turned to Colin Rea. While he maintains his status as a decent and useful arm, Rea is not someone any team should be turning to in a tie game in the playoffs. He performed admirably before eventually giving up a home run to Andrew Vaughn to make it 2-1 Brewers, who went on to win the game 3-1. Running out of pitching in the final game of the NLDS is a precarious place to be, especially when you consider that the Los Angeles Dodgers were waiting on the other side of that Game 5. The root of the issue is traced all the way back to the trade deadline, when Jed Hoyer knew his team needed pitching, and all he came away with was Michael Soroka, Taylor Rogers, and Andrew Kittredge. Our @Jeremy Tecktiel recently revisited the 2025 deadline here, so we won’t get too in-depth in this piece. In case you’ve forgotten, though, let me jog your memory: the Cubs sorely needed pitchers to help out an offense that was one of the best in baseball. The Cubs then acquired the three guys above, and none of those guys made a huge impact. Soroka got hurt in his first start as a Cub, returning in time to give up three runs in one inning of postseason work. Rogers made little impact and threw just one, low-leverage postseason inning. And while Kittredge was key to beating the San Diego Padres in the Wild Card round, he only threw 2.2 innings. One impactful bullpen arm was not enough. You might argue that it’s hard to pin the Game 5 loss on the pitching, given that the offense only came through with one run that game. That’s fair, though I am here to say that Jed Hoyer never even gave the offense a chance. After Michael Busch got the Cubs off to an early 1-0 lead with a lead-off home run in Game 1, Boyd promptly surrendered six runs in the bottom half of the first. After Seiya Suzuki spotted the Cubs to a 3-0 lead in Game 2, Shota Imanaga immediately gave that lead back by allowing a three-run home run to Andrew Vaughn. The offense failed to come through, sure, but that offense was good enough to do damage in the playoffs. The fact of the matter is that they never had a chance to win the World Series, or even the Division Series, because of the pitching. And that is because Jed Hoyer failed to appropriately supplement his team at the trade deadline. Now here the Cubs sit in 2026 in the exact same situation. They have a top five offense by almost any measure. Their pitching, on the other hand, sports a 4.19 ERA, which is 15th in baseball. Frankly, that number is propped up by an elite defense. FIP, which is a stat that attempts to isolate what a pitcher can truly control, rates this Cubs staff as 25th in baseball. FanGraphs WAR rates them at 27th. Their strikeout rate, despite Hoyer constantly saying they were going to work hard to increase that in the offseason, is 22nd. The 2025 trade deadline was a failure. The 2026 trade deadline has to be better. I am not saying that the Cubs need to go get Tarik Skubal. Even two mid-tier starting pitchers would help this team immensely, because right now, the North Siders probably only have two starters that should even be sniffing a postseason mound. Boyd is a good pitcher, but should probably be starting Game 3 or 4 of a playoff series, not the opener, as he likely would for the Cubs right now. Ditto for Imanaga, who gives up way too many home runs to be trusted in October (as we saw last year). The options after that get bleak fast. Jameson Taillon has been worth -0.8 fWAR, one of the lowest figures in baseball. Colin Rea should not be on a postseason mound. David Peterson has been good in three of his four starts in a Cubs uniform, but in the other one, he gave up 10 runs. I wouldn’t guarantee that Edward Cabrera or Ben Brown will be making a huge impact here, either. What about the bullpen? Some guys have had some flashes, sure, but in July so far they have posted an unsightly 4.69 ERA. Who are we supposed to trust out of that group? With this cobbled-together pitching staff, the Cubs still have an 87.1 percent chance to make the playoffs, and a 4.2 percent chance of winning the World Series, per FanGraphs’ playoff odds. Just imagine what they could do with a couple of extra competent pitchers on the staff? Last season, Hoyer failed to go out and get those pitchers. Reportedly, the lockout scared him away, and those fears will be heightened this year. But this team won't go further than they did last year if fear controls the front office's thinking over the next week.
 -
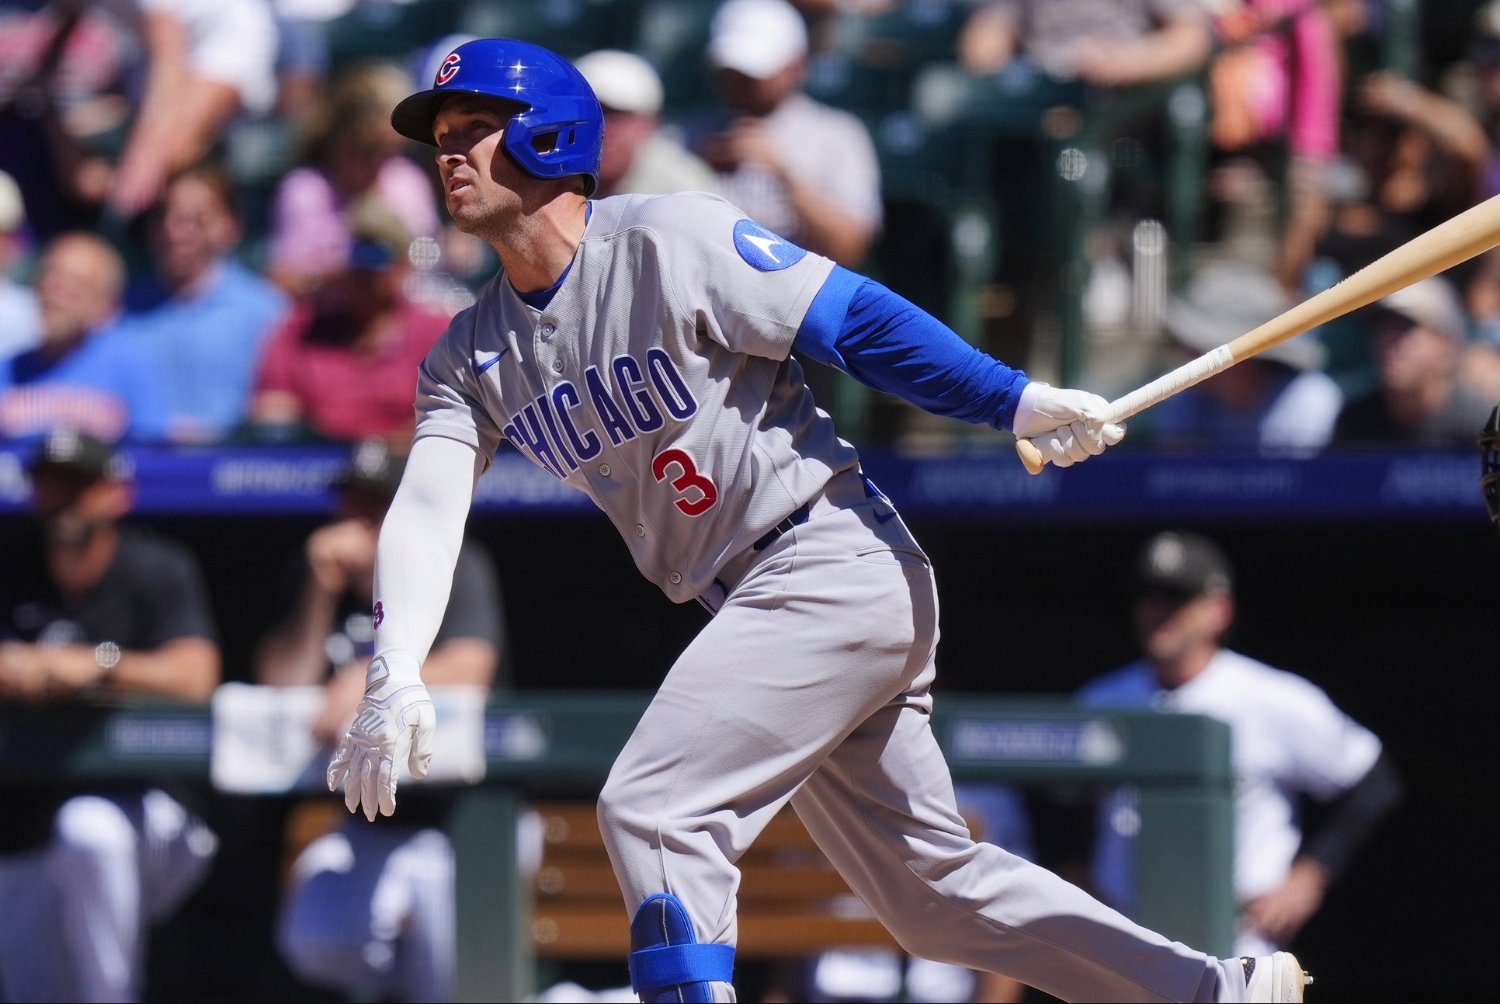
Image courtesy of © Matt Marton-Imagn Images Something that has struck me, as I have listened to David Ross and Anthony Rizzo’s podcast, The Lovable Reunion (where they reminisce with those that were a part of that team), is how inevitable that 2016 Cubs group felt. I feel like I live and die with every pitch of the 2026 Cubs, because I have to. If they lose three or four in a row, that could easily be devastating to their playoff chances. The 2016 team, though, was different. With 103 wins, they finished with the best record in the National League by a full eight wins. They won the division by 17.5 games, and were never less than 6.5 games up on second place during the second half of the season. They started 25-6, for crying out loud—and they didn't follow it up with some 10-game losing skein. All of this is to say, the 2026 Cubs are probably a good baseball team, but the 2016 Cubs were an elite baseball team. How would the 2026 Cubs fare if they faced the 2016 Cubs? With the new baseball simulation tool at FanGraphs, we can figure this out! First, we have to decide on our lineups. I thought we’d simulate one game with lefties on the mound for both teams, and then another with righties on the mound. We’re going to use the Marcel projection system, since it is one of the only systems that will project back in time, which is necessary for the 2016 team. I’ve also disabled home-field advantage. These games are played at Wrigley Field, in theory, where fans are cheering for both teams. Game 1 Lineups 2026 Cubs Pete Crow-Armstrong Seiya Suzuki Alex Bregman Carson Kelly Michael Busch Ian Happ Nico Hoerner Matt Shaw Dansby Swanson Pitchers - Matthew Boyd, Ryan Rolison, Hoby Milner, Jacob Webb, Daniel Palencia 2016 Cubs Dexter Fowler Kris Bryant Anthony Rizzo Ben Zobrist Addison Russell Willson Contreras Jorge Soler Javier Báez Kyle Schwarber Pitchers - Jon Lester, Carl Edwards Jr., Héctor Rondón, Pedro Strop, Aroldis Chapman Here's how it went down. The 2016 Cubs, of course, win this matchup much more often than the 2026 Cubs. However, I was shocked to discover that they win the matchup 65.3% of the time. On any given day in MLB, it’s hard to find any team that has almost a two-in-three chance of winning. Some of this is probably accounted for by the fact that the league-average hitter in 2016 was better than the league-average hitter in 2026. That was just a better offensive environment, and that might make this slightly unfair—although the difference should be counterbalanced by the easier pitching environment, right? Indeed, the lion's share of the difference, in my opinion—and this won’t shock you—is in the pitching. Cubs hitters this year have a 109 wRC+. The 2016 Cubs had a 106 wRC+. Cubs pitchers in 2016 had an ERA- of 76. That figure is at 104 this year. ERA- is basically wRC+ for pitchers. It’s adjusted for league average and park factors, and 100 is average. Unlike wRC+ (and more like ERA), you want this number to be below 100. In other terms, Cubs pitchers were 24 percent better than league average in 2016. In 2026, they are 4 percent worse than average. The simulation bears this out. The 2016 Cubs crush to the tune of a .274/.353/.465 slash line, while the 2026 Cubs manage a line of just .233/.300/.384. This gives the 2016 Cubs 5.35 average runs scored, and the 2026 Cubs just an average of 3.92. Fun fact: when I first tried this simulation with Shota Imanaga pitching instead of Boyd, I noticed that Kris Bryant projects to hit a home run off of Imanaga in 7.3 percent of plate appearances. That didn’t seem very fair, but it also does bring back a smile, doesn't it? Bryant, especially against a pitcher prone to fly balls anyway, was that kind of lethal in his MVP-winning season. Will the 2026 squad fare any better with right-handed starters? Game 2 Lineups 2026 Cubs Crow-Armstrong Bregman Busch Suzuki Happ Michael Conforto Kelly Hoerner Swanson Pitchers - Ben Brown, Rolison, Milner, Webb, Palencia 2016 Cubs Fowler Schwarber Bryant Rizzo Zobrist Russell Contreras Jason Heyward Báez Pitchers - Kyle Hendricks, Edwards Jr., Rondón, Strop, Chapman It, uh, didn't get any better for the current Men in Blue. Having Brown on the mound instead of Boyd certainly helps the present day iteration of the Cubs. (Alas: we might even be giving the 2026 squad an unfair advantage here. Brown might be out for the year.) The 2016 group hits for a slash line of .266/.346/.443 and scores 4.99 runs per game in this one, over a third of a run less. Having Hendricks on the mound instead of Lester, though, is of no help. The 2026 Cubs hit a paltry .228/.296/.375 and score only 3.77 runs per game. It turns out, the 2016 team still wins this 64.4 percent of the time. Crow-Armstrong does what he can for the 2026 Cubs: he pops a home run in 17 percent of the games in this simulation. That pales in comparison to the middle of the 2016 lineup, though: Schwarber homers in 20 percent of the games, Bryant 21 percent, and Rizzo 19 percent. This brings me all the way back to my original point: the 2016 Cubs were inevitable. The 2026 team has been fun, at times, and frustrating at others. The 2016 team was an unstoppable force. And if these projections are any indication, they would demolish the Cubs that we see playing baseball just 10 years later. If that seems to augur ill for the current club's playoff chances, well, yeah. It does. But it also highlights the historic thunder of that drought-snapping team. View full article
-
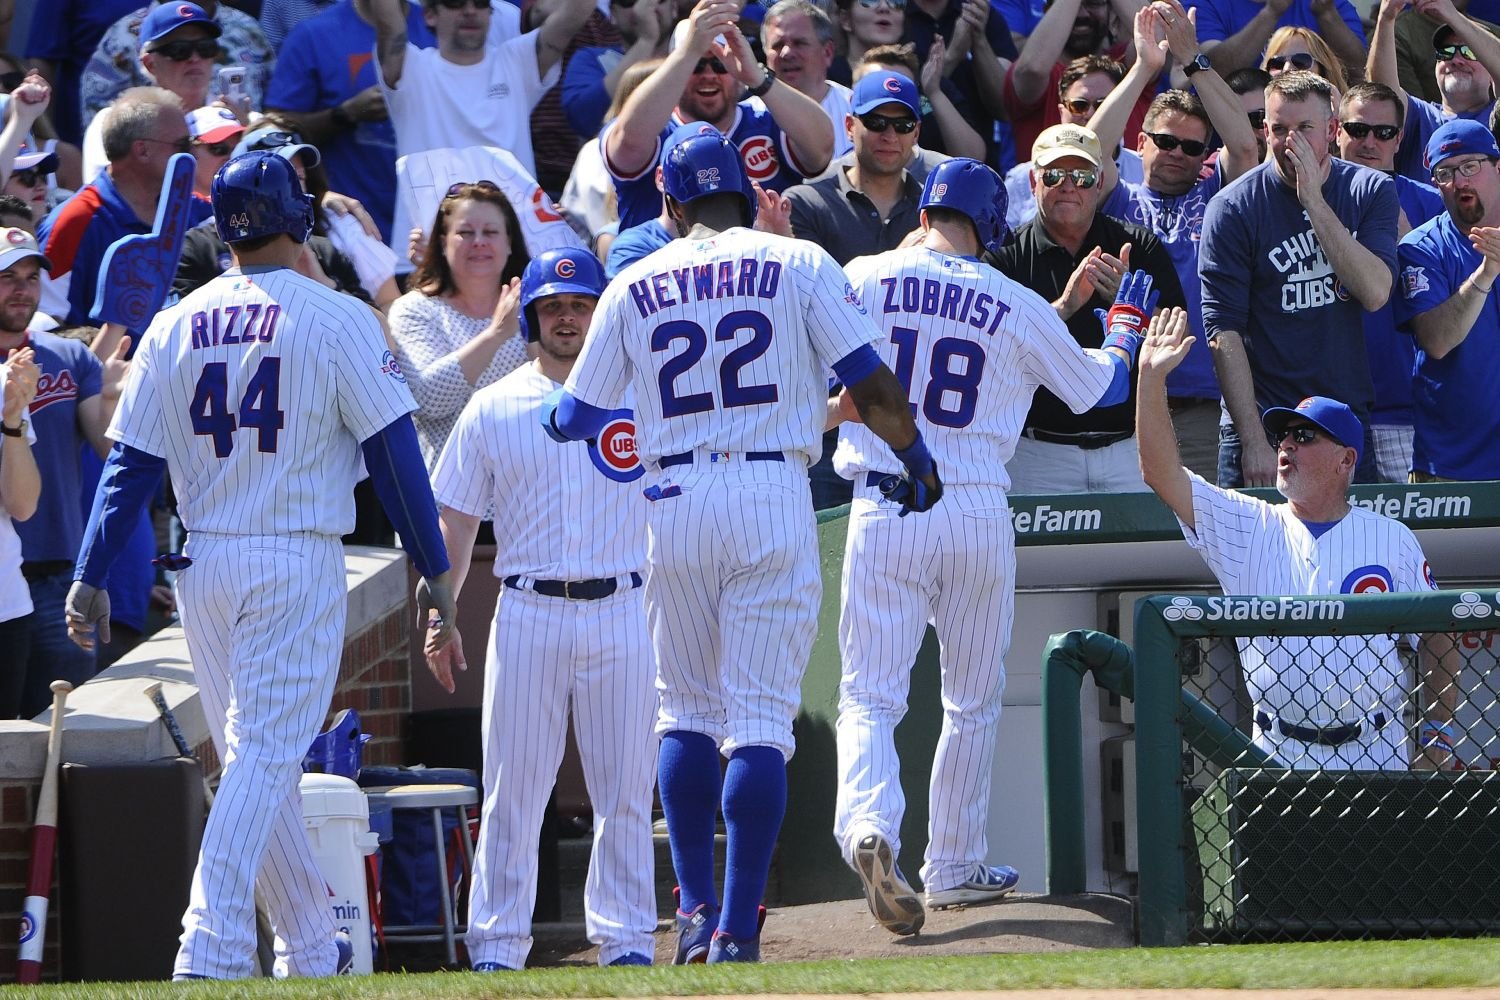 Something that has struck me, as I have listened to David Ross and Anthony Rizzo’s podcast, The Lovable Reunion (where they reminisce with those that were a part of that team), is how inevitable that 2016 Cubs group felt. I feel like I live and die with every pitch of the 2026 Cubs, because I have to. If they lose three or four in a row, that could easily be devastating to their playoff chances. The 2016 team, though, was different. With 103 wins, they finished with the best record in the National League by a full eight wins. They won the division by 17.5 games, and were never less than 6.5 games up on second place during the second half of the season. They started 25-6, for crying out loud—and they didn't follow it up with some 10-game losing skein. All of this is to say, the 2026 Cubs are probably a good baseball team, but the 2016 Cubs were an elite baseball team. How would the 2026 Cubs fare if they faced the 2016 Cubs? With the new baseball simulation tool at FanGraphs, we can figure this out! First, we have to decide on our lineups. I thought we’d simulate one game with lefties on the mound for both teams, and then another with righties on the mound. We’re going to use the Marcel projection system, since it is one of the only systems that will project back in time, which is necessary for the 2016 team. I’ve also disabled home-field advantage. These games are played at Wrigley Field, in theory, where fans are cheering for both teams. Game 1 Lineups 2026 Cubs Pete Crow-Armstrong Seiya Suzuki Alex Bregman Carson Kelly Michael Busch Ian Happ Nico Hoerner Matt Shaw Dansby Swanson Pitchers - Matthew Boyd, Ryan Rolison, Hoby Milner, Jacob Webb, Daniel Palencia 2016 Cubs Dexter Fowler Kris Bryant Anthony Rizzo Ben Zobrist Addison Russell Willson Contreras Jorge Soler Javier Báez Kyle Schwarber Pitchers - Jon Lester, Carl Edwards Jr., Héctor Rondón, Pedro Strop, Aroldis Chapman Here's how it went down. The 2016 Cubs, of course, win this matchup much more often than the 2026 Cubs. However, I was shocked to discover that they win the matchup 65.3% of the time. On any given day in MLB, it’s hard to find any team that has almost a two-in-three chance of winning. Some of this is probably accounted for by the fact that the league-average hitter in 2016 was better than the league-average hitter in 2026. That was just a better offensive environment, and that might make this slightly unfair—although the difference should be counterbalanced by the easier pitching environment, right? Indeed, the lion's share of the difference, in my opinion—and this won’t shock you—is in the pitching. Cubs hitters this year have a 109 wRC+. The 2016 Cubs had a 106 wRC+. Cubs pitchers in 2016 had an ERA- of 76. That figure is at 104 this year. ERA- is basically wRC+ for pitchers. It’s adjusted for league average and park factors, and 100 is average. Unlike wRC+ (and more like ERA), you want this number to be below 100. In other terms, Cubs pitchers were 24 percent better than league average in 2016. In 2026, they are 4 percent worse than average. The simulation bears this out. The 2016 Cubs crush to the tune of a .274/.353/.465 slash line, while the 2026 Cubs manage a line of just .233/.300/.384. This gives the 2016 Cubs 5.35 average runs scored, and the 2026 Cubs just an average of 3.92. Fun fact: when I first tried this simulation with Shota Imanaga pitching instead of Boyd, I noticed that Kris Bryant projects to hit a home run off of Imanaga in 7.3 percent of plate appearances. That didn’t seem very fair, but it also does bring back a smile, doesn't it? Bryant, especially against a pitcher prone to fly balls anyway, was that kind of lethal in his MVP-winning season. Will the 2026 squad fare any better with right-handed starters? Game 2 Lineups 2026 Cubs Crow-Armstrong Bregman Busch Suzuki Happ Michael Conforto Kelly Hoerner Swanson Pitchers - Ben Brown, Rolison, Milner, Webb, Palencia 2016 Cubs Fowler Schwarber Bryant Rizzo Zobrist Russell Contreras Jason Heyward Báez Pitchers - Kyle Hendricks, Edwards Jr., Rondón, Strop, Chapman It, uh, didn't get any better for the current Men in Blue. Having Brown on the mound instead of Boyd certainly helps the present day iteration of the Cubs. (Alas: we might even be giving the 2026 squad an unfair advantage here. Brown might be out for the year.) The 2016 group hits for a slash line of .266/.346/.443 and scores 4.99 runs per game in this one, over a third of a run less. Having Hendricks on the mound instead of Lester, though, is of no help. The 2026 Cubs hit a paltry .228/.296/.375 and score only 3.77 runs per game. It turns out, the 2016 team still wins this 64.4 percent of the time. Crow-Armstrong does what he can for the 2026 Cubs: he pops a home run in 17 percent of the games in this simulation. That pales in comparison to the middle of the 2016 lineup, though: Schwarber homers in 20 percent of the games, Bryant 21 percent, and Rizzo 19 percent. This brings me all the way back to my original point: the 2016 Cubs were inevitable. The 2026 team has been fun, at times, and frustrating at others. The 2016 team was an unstoppable force. And if these projections are any indication, they would demolish the Cubs that we see playing baseball just 10 years later. If that seems to augur ill for the current club's playoff chances, well, yeah. It does. But it also highlights the historic thunder of that drought-snapping team.
 -
 If Tuesday night’s victory over the Baltimore Orioles was any indication, the Cubs might start looking to Trent Thornton to pitch in higher-leverage opportunities going forward. The right-hander notched his second save of the season with a scoreless ninth inning. This was in a game that was after an off day, which is to say that the bullpen was rested. Craig Counsell had his pick of the litter, and he picked Thornton. That is quite the leap for a guy who started the season in Iowa and wasn’t called up to the big-league club until early May. It’s also quite the leap for me, because I have a small bias: I have a really hard time believing in relievers who don’t rack up big strikeout numbers. This makes Thornton and his minuscule 12.5% strikeout rate hard for me to embrace. No qualified pitcher has a lower strikeout rate. Combine that with a walk rate a tick above league average, and you have what looks to be a frustrating bullpen arm. But should I trust Thornton more? Counsell is certainly starting to, and he knows way more than I do. The thing is, Thornton has gotten results. His 2.63 ERA out of the bullpen is one of the best on the team. However, any advanced metric would suggest that is entirely smoke and mirrors. He has a 5.03 xERA and a 5.28 FIP. His .171 BABIP (batting average on balls in play) is the sixth-lowest among pitchers with at least 20 innings pitched, according to FanGraphs. For context, league-average BABIP is .288 so far this season. So, he doesn’t strike a lot of people, but he gets them out when they put the ball in play. What’s the big deal? Maintaining a BABIP that low isn’t usually a product of any particular skill; it’s luck. Put enough balls in play and eventually some of them will find a hole. That being said, there’s still a scale to BABIP. Some pitchers run higher ones, and others lower ones. Can’t Thornton just be one of the guys that runs a low one? The answer is yes, though probably not as low as .171. Here's what Thornton has going for him: entering Wednesday’s action, he is posting a 50.6% ground ball rate and just a 13.9% line drive rate. By giving up a lot of ground balls, Thornton avoids giving up extra-base hits, and by allowing so few line drives, he avoids the type of contact that generally leads to a high batting average. So why does his FIP think he is getting so lucky? Even though he is keeping the ball on the ground, the former Tar Heel is still getting lucky when you consider how few of those ground balls manage find the outfield grass: Batted Ball Type Batting Average Expected Batting Average BA-xBA Ground Ball .125 .271 -.146 Line Drive .500 .529 -.029 Fly Ball .263 .295 -.032 He’s getting better results on line drives and fly balls than expected, though not egregiously so. It’s the ground balls that really stick out. In fact, among 411 pitchers who have recorded at least 25 ground balls this year, only one has a more significant gap between his batting average allowed and his expected batting average than Thornton, per Baseball Savant. If you sort through all of Thornton’s outs recorded on the ground, you’ll definitely see some web gems: M3k2QTFfWGw0TUFRPT1fVjFJQUJRY01Yd01BQ3daVVhnQUhCRlVIQUFNSFZWQUFBUUZRQWxJR0JBdFFDVlpm.mp4 Because of the high number of ground balls he has been able to induce, Thornton is uniquely positioned to take advantage of an infield defense that is arguably the best in baseball. The Cubs as a team have allowed a .224 batting average on ground balls this year, second-lowest in baseball. Their -.027 gap between that batting average and their expected batting average is also the second-lowest. Is Trent Thornton getting lucky? Almost certainly. With the highest ground ball rate among the pitchers on the active roster, though, he should be expected to be getting a little bit lucky, given the infield defense behind him. You create your own luck. Rather, Alex Bregman, Dansby Swanson, Nico Hoerner and Michael Busch create it, for Thornton. He's not a relief ace. Still, I have almost talked myself into him being a serviceable bullpen arm for the Cubs for the remainder of the season. That alone has a lot of value to the team right now.
 -
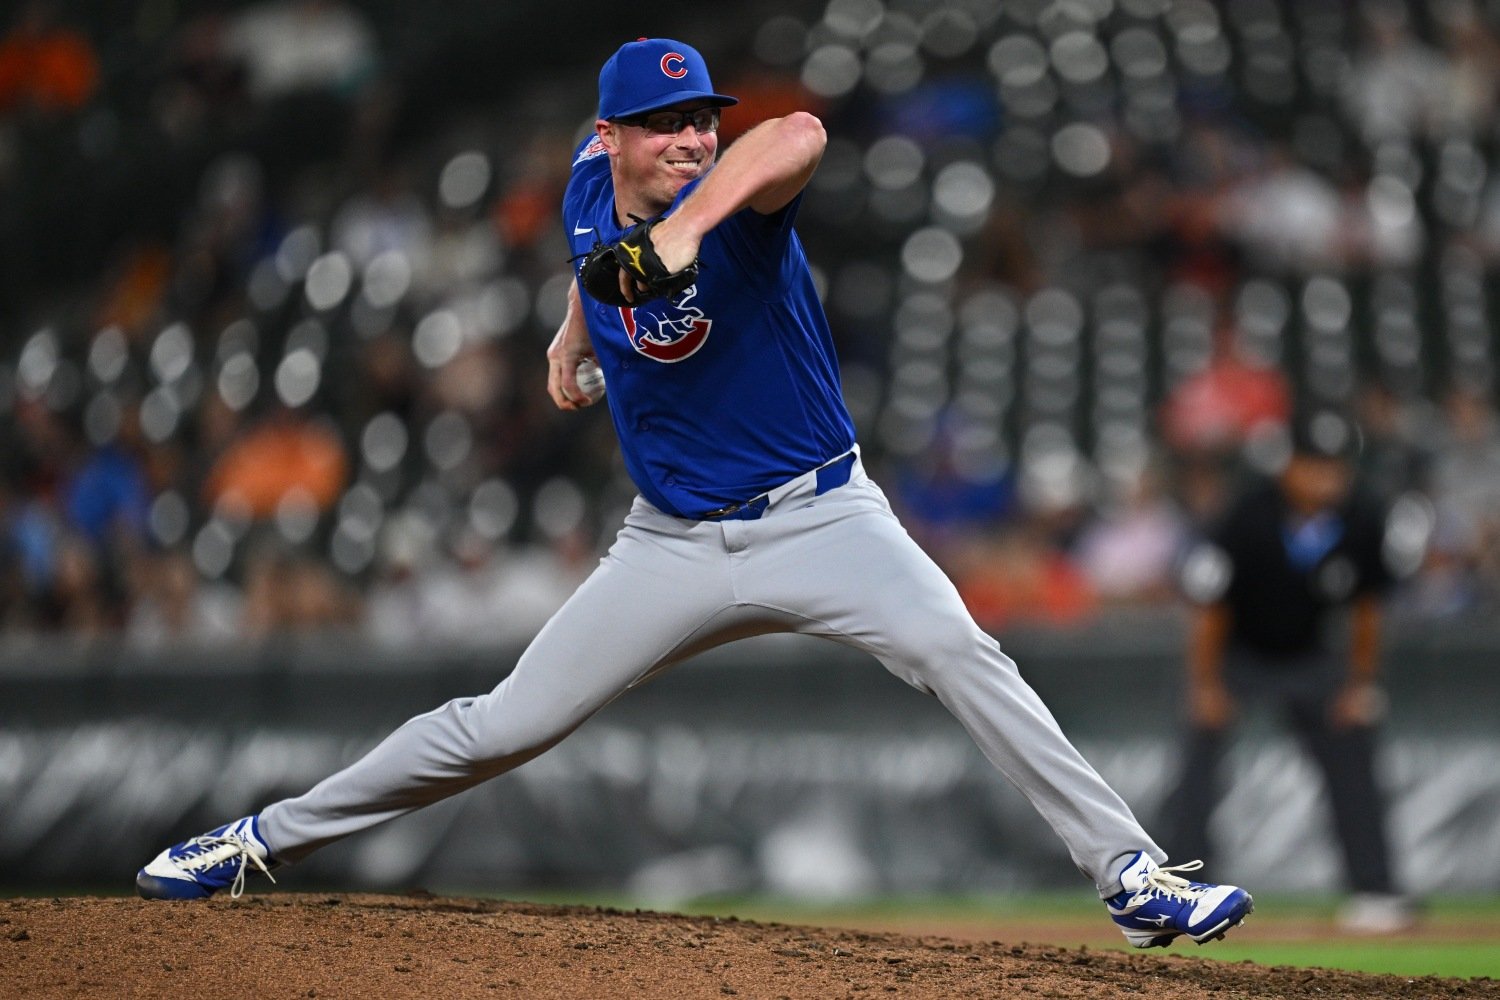
Image courtesy of © Jamie Sabau-Imagn Images If Tuesday night’s victory over the Baltimore Orioles was any indication, the Cubs might start looking to Trent Thornton to pitch in higher-leverage opportunities going forward. The right-hander notched his second save of the season with a scoreless ninth inning. This was in a game that was after an off day, which is to say that the bullpen was rested. Craig Counsell had his pick of the litter, and he picked Thornton. That is quite the leap for a guy who started the season in Iowa and wasn’t called up to the big-league club until early May. It’s also quite the leap for me, because I have a small bias: I have a really hard time believing in relievers who don’t rack up big strikeout numbers. This makes Thornton and his minuscule 12.5% strikeout rate hard for me to embrace. No qualified pitcher has a lower strikeout rate. Combine that with a walk rate a tick above league average, and you have what looks to be a frustrating bullpen arm. But should I trust Thornton more? Counsell is certainly starting to, and he knows way more than I do. The thing is, Thornton has gotten results. His 2.63 ERA out of the bullpen is one of the best on the team. However, any advanced metric would suggest that is entirely smoke and mirrors. He has a 5.03 xERA and a 5.28 FIP. His .171 BABIP (batting average on balls in play) is the sixth-lowest among pitchers with at least 20 innings pitched, according to FanGraphs. For context, league-average BABIP is .288 so far this season. So, he doesn’t strike a lot of people, but he gets them out when they put the ball in play. What’s the big deal? Maintaining a BABIP that low isn’t usually a product of any particular skill; it’s luck. Put enough balls in play and eventually some of them will find a hole. That being said, there’s still a scale to BABIP. Some pitchers run higher ones, and others lower ones. Can’t Thornton just be one of the guys that runs a low one? The answer is yes, though probably not as low as .171. Here's what Thornton has going for him: entering Wednesday’s action, he is posting a 50.6% ground ball rate and just a 13.9% line drive rate. By giving up a lot of ground balls, Thornton avoids giving up extra-base hits, and by allowing so few line drives, he avoids the type of contact that generally leads to a high batting average. So why does his FIP think he is getting so lucky? Even though he is keeping the ball on the ground, the former Tar Heel is still getting lucky when you consider how few of those ground balls manage find the outfield grass: Batted Ball Type Batting Average Expected Batting Average BA-xBA Ground Ball .125 .271 -.146 Line Drive .500 .529 -.029 Fly Ball .263 .295 -.032 He’s getting better results on line drives and fly balls than expected, though not egregiously so. It’s the ground balls that really stick out. In fact, among 411 pitchers who have recorded at least 25 ground balls this year, only one has a more significant gap between his batting average allowed and his expected batting average than Thornton, per Baseball Savant. If you sort through all of Thornton’s outs recorded on the ground, you’ll definitely see some web gems: M3k2QTFfWGw0TUFRPT1fVjFJQUJRY01Yd01BQ3daVVhnQUhCRlVIQUFNSFZWQUFBUUZRQWxJR0JBdFFDVlpm.mp4 Because of the high number of ground balls he has been able to induce, Thornton is uniquely positioned to take advantage of an infield defense that is arguably the best in baseball. The Cubs as a team have allowed a .224 batting average on ground balls this year, second-lowest in baseball. Their -.027 gap between that batting average and their expected batting average is also the second-lowest. Is Trent Thornton getting lucky? Almost certainly. With the highest ground ball rate among the pitchers on the active roster, though, he should be expected to be getting a little bit lucky, given the infield defense behind him. You create your own luck. Rather, Alex Bregman, Dansby Swanson, Nico Hoerner and Michael Busch create it, for Thornton. He's not a relief ace. Still, I have almost talked myself into him being a serviceable bullpen arm for the Cubs for the remainder of the season. That alone has a lot of value to the team right now. View full article
-
 Catching is rapidly becoming a position that is very difficult to project. In addition to all of the other modern responsibilities that a catcher has in terms of managing a pitching staff, the physical toll the position takes on the body makes it tough to post quality numbers year in and year out. In fact, this was the subject of a recent article at FanGraphs, by Ben Clemens. Within the article, which you should read, Clemens notes that every year, there are new players who pop up to be considered the best catcher in baseball. Yet, every year, one of them immediately falls off to be replaced by someone else. “It’s hard to stand out all the way at catcher, and it’s also hard to stay near the top for long,” he concluded. Over the past two seasons, the Cubs have artfully straddled a line at catcher. Carson Kelly and Miguel Amaya certainly aren’t big-name players like Cal Raleigh or Adley Rutschman, but they are both decent big-league backstops. Since the start of 2025, the Cubs are fifth in baseball in FanGraphs WAR from the catcher position, and they're 13th so far in 2026 alone. The Cubs have gotten some production from Reese McGuire and Moises Ballesteros behind the dish, too. However, given that Kelly and Amaya have received the super-majority of the playing time this season, we’ll focus on those guys. Neither is spectacular defensively, though they both manage to do pretty much everything well enough that it doesn’t significantly hamper their value. Catcher Catcher Blocking Runs Catcher Framing Runs Catcher Stealing Runs Carson Kelly 1 0 -3 Miguel Amaya -1 0 1 The three metrics above, all of which come via Baseball Savant and are from 2026 only, convert a catcher’s ability to block pitches, frame pitches, and control the running game into runs. So, for example, Kelly’s pitch blocking has contributed one run to the Cubs this season, while Amaya’s has cost the Cubs one run. The only number up there that isn’t hanging right around average is Kelly’s -3 stealing runs. That's the third worst figure in baseball. He's caught just 11% of attempted basestealers this season, despite Baseball Savant estimating he should have caught 24% of them. Where both guys stand out a little bit more is at the plate. The team’s 107 wRC+ over the past two seasons is sixth in baseball. Their 104 wRC+ this season is ninth. Interestingly, both guys have maintained a similar level of offensive production between 2025 and 2026, but in completely different ways. Last season, Kelly rode a 23.9% pulled air rate to a .249/.333/.428 batting line, 115 wRC+, and 17 home runs. This season, his pulled air rate is down to 15.2%, which has resulted in significantly less power; he has just four home runs roughly halfway through the season. Yet, he's maintained a 116 wRC+, thanks to an elevated batting average of .280 and an on-base percentage of .366. Instead of the pulled balls in the air, the catcher’s ground ball rate has gone from 38.2% last season to 46.3% this year. He's seeing significantly better results on those ground balls this year, which unfortunately suggests to me that his current batting line might not be sustainable: Year Batting Average on Ground Balls 2025 .214 2026 .342 As for Amaya, he hit a robust .281/.314/.500 last season, good for a 124 wRC+. This year, his slugging average is down to .347, but like Kelly, his on-base percentage has increased—to .352, which is managing to keep his batting line above average with a 104 wRC+. In 2024, Amaya had just a 6.3% walk rate, and last year, it was just 3.9%. This year, it’s all the way up to 11.6%. That's because he has completely cut his swing rate on all pitches. Last season, he swung at 54% of the pitches he saw. This year, it’s just 43.7%. This has its drawbacks since Amaya is neglecting to swing at hittable pitches in the heart of the zone, too. Though, it all might be intentional: Amaya’s swing speed is down over two miles per hour, from 72.2 mph last season to 70 mph this year. He missed a large chunk of last season with an oblique injury. Perhaps he doesn’t feel like he can swing as hard coming off of that injury, and this is his way of compensating. Regardless, the Cubs’ catching duo has been a hallmark of stability over the past two seasons. Catcher is a position that is hard to remain consistently good at, yet the Cubs have managed to do just that with a couple of mostly unheralded guys. They'll need both players to remain productive if they want to stay afloat in the playoff race down the stretch.
 -
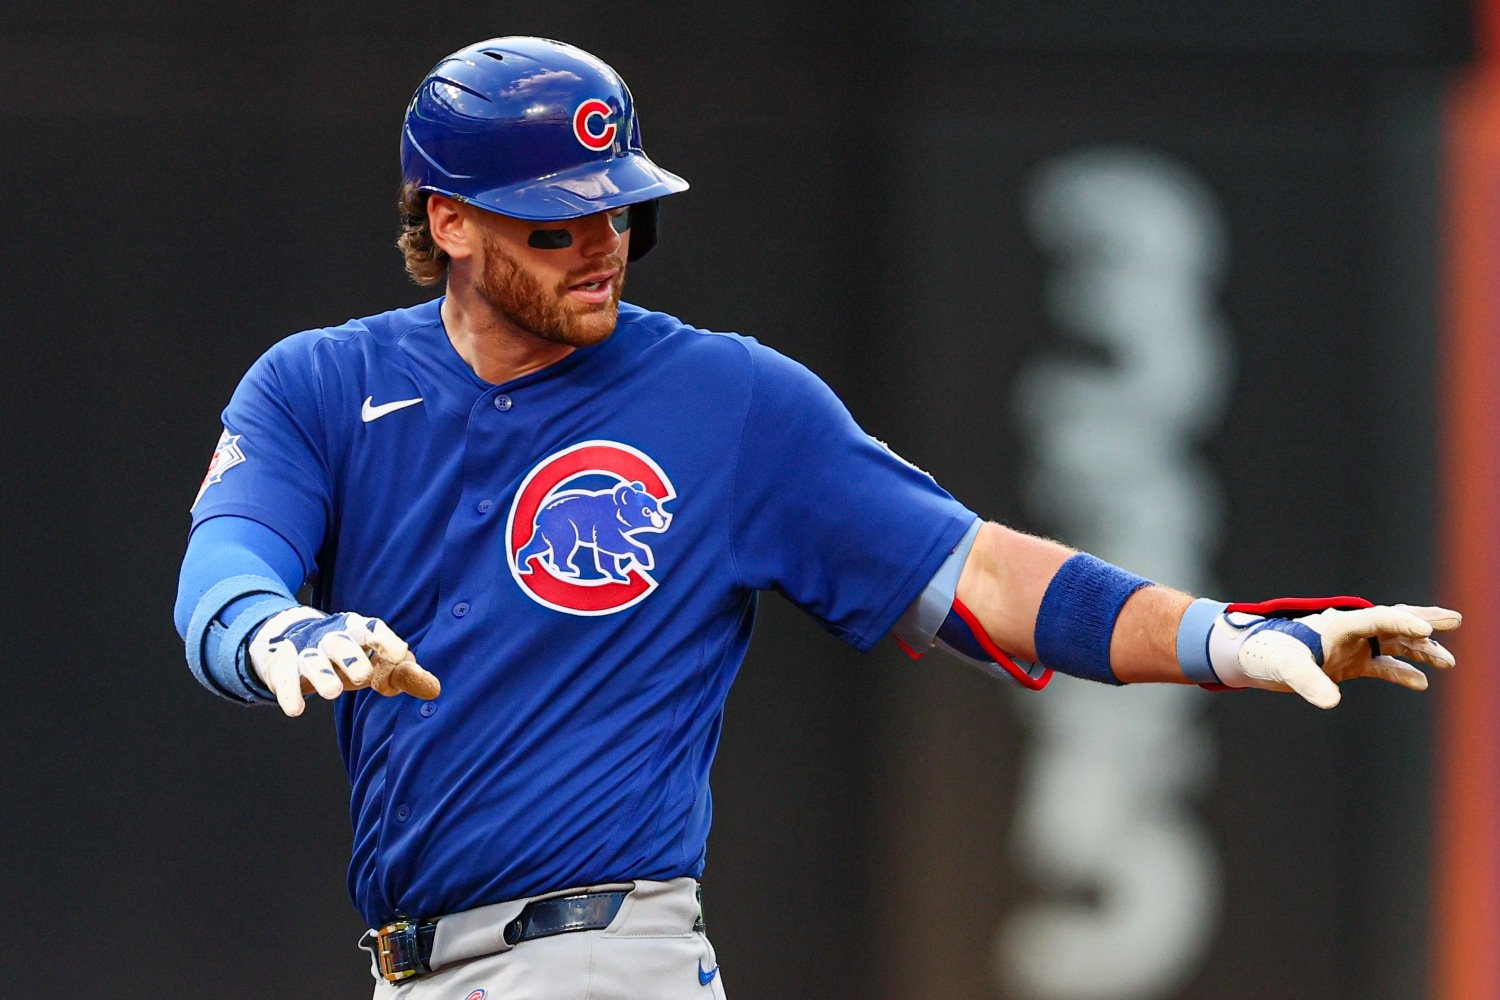
Image courtesy of © Vincent Carchietta-Imagn Images Catching is rapidly becoming a position that is very difficult to project. In addition to all of the other modern responsibilities that a catcher has in terms of managing a pitching staff, the physical toll the position takes on the body makes it tough to post quality numbers year in and year out. In fact, this was the subject of a recent article at FanGraphs, by Ben Clemens. Within the article, which you should read, Clemens notes that every year, there are new players who pop up to be considered the best catcher in baseball. Yet, every year, one of them immediately falls off to be replaced by someone else. “It’s hard to stand out all the way at catcher, and it’s also hard to stay near the top for long,” he concluded. Over the past two seasons, the Cubs have artfully straddled a line at catcher. Carson Kelly and Miguel Amaya certainly aren’t big-name players like Cal Raleigh or Adley Rutschman, but they are both decent big-league backstops. Since the start of 2025, the Cubs are fifth in baseball in FanGraphs WAR from the catcher position, and they're 13th so far in 2026 alone. The Cubs have gotten some production from Reese McGuire and Moises Ballesteros behind the dish, too. However, given that Kelly and Amaya have received the super-majority of the playing time this season, we’ll focus on those guys. Neither is spectacular defensively, though they both manage to do pretty much everything well enough that it doesn’t significantly hamper their value. Catcher Catcher Blocking Runs Catcher Framing Runs Catcher Stealing Runs Carson Kelly 1 0 -3 Miguel Amaya -1 0 1 The three metrics above, all of which come via Baseball Savant and are from 2026 only, convert a catcher’s ability to block pitches, frame pitches, and control the running game into runs. So, for example, Kelly’s pitch blocking has contributed one run to the Cubs this season, while Amaya’s has cost the Cubs one run. The only number up there that isn’t hanging right around average is Kelly’s -3 stealing runs. That's the third worst figure in baseball. He's caught just 11% of attempted basestealers this season, despite Baseball Savant estimating he should have caught 24% of them. Where both guys stand out a little bit more is at the plate. The team’s 107 wRC+ over the past two seasons is sixth in baseball. Their 104 wRC+ this season is ninth. Interestingly, both guys have maintained a similar level of offensive production between 2025 and 2026, but in completely different ways. Last season, Kelly rode a 23.9% pulled air rate to a .249/.333/.428 batting line, 115 wRC+, and 17 home runs. This season, his pulled air rate is down to 15.2%, which has resulted in significantly less power; he has just four home runs roughly halfway through the season. Yet, he's maintained a 116 wRC+, thanks to an elevated batting average of .280 and an on-base percentage of .366. Instead of the pulled balls in the air, the catcher’s ground ball rate has gone from 38.2% last season to 46.3% this year. He's seeing significantly better results on those ground balls this year, which unfortunately suggests to me that his current batting line might not be sustainable: Year Batting Average on Ground Balls 2025 .214 2026 .342 As for Amaya, he hit a robust .281/.314/.500 last season, good for a 124 wRC+. This year, his slugging average is down to .347, but like Kelly, his on-base percentage has increased—to .352, which is managing to keep his batting line above average with a 104 wRC+. In 2024, Amaya had just a 6.3% walk rate, and last year, it was just 3.9%. This year, it’s all the way up to 11.6%. That's because he has completely cut his swing rate on all pitches. Last season, he swung at 54% of the pitches he saw. This year, it’s just 43.7%. This has its drawbacks since Amaya is neglecting to swing at hittable pitches in the heart of the zone, too. Though, it all might be intentional: Amaya’s swing speed is down over two miles per hour, from 72.2 mph last season to 70 mph this year. He missed a large chunk of last season with an oblique injury. Perhaps he doesn’t feel like he can swing as hard coming off of that injury, and this is his way of compensating. Regardless, the Cubs’ catching duo has been a hallmark of stability over the past two seasons. Catcher is a position that is hard to remain consistently good at, yet the Cubs have managed to do just that with a couple of mostly unheralded guys. They'll need both players to remain productive if they want to stay afloat in the playoff race down the stretch. View full article
-
Image courtesy of © David Banks-Imagn Images There’s been a lot of consternation about Dansby Swanson this year, and rightfully so. He has been really bad at the plate, after all. Heading into their late-June series against the New York Mets, his wRC+, which is an all-encompassing offensive statistic where 100 is average, sits at just 77, according to FanGraphs. Not only does this mean that he is 23 percent worse than the league-average hitter, but this ranks him as the 16th-worst qualified hitter in baseball. Like I said, he's been really bad at the plate. The thing with Swanson is that offense has never been his calling card. Even at his absolute best, the Chicago Cubs’ shortstop has never been any more more than a slightly above-average hitter. His ability to play exceptional defense at a premium position like shortstop is what has made him one of the most valuable players in baseball throughout the course of the 2020s. Until last year, that is. Per Baseball Savant, Swanson was worth two runs above average in the field last season. That was his worst defensive season since 2019. What was different? Swanson went from being elite to merely good at coming in on the ball, while also falling from above average to below average at moving laterally: Year Coming In (OAA) Lateral toward 3B (OAA) Lateral toward 1B (OAA) Going Back (OAA) 2024 14 2 2 -1 2025 9 -1 -2 -1 The values in the table represent the outs above average on each respective play type. At his defensive peak from 2022 to 2023, Swanson was not only elite at coming in on the ball, but also at moving towards third base: he was worth 12 outs above average moving towards third in 2022, and eight in 2023. This declined significantly in 2024, and all but disappeared in 2025. This year, though, he has been worth four outs above average moving toward third base and we’re only halfway through the season. To put this in simpler terms: he is making more plays in the hole between him and third base than he was last year: TDZObzlfWGw0TUFRPT1fQWdVRkFsTlJWd0FBV2dZQ1VnQUhCZ0JlQUFCUkFBTUFVRllEVmdaV0IxZGRWUUlG.mp4 The former Atlanta Brave has also been worth 0 outs above average on plays towards first base, an improvement over his below-average output in 2025. He’s also maintained a steady performance coming in on the ball, worth five outs above average in that regard. Cobble all of that together and Swanson has been worth seven runs above average and nine outs above average in the field so far this year, both of which are seventh in baseball. This is after being worth two runs above average and four outs above average just last season. Despite being one of the worst qualified hitters in baseball, he has still posted 1.5 fWAR, fifth among the Cubs’ position players and more than Alex Bregman, Nico Hoerner, and Carson Kelly. He is on pace for 3.2 fWAR after posting 3.3 last season. Is this all a glass half full view of Dansby Swanson? Of course it is! But we all need that right now while we stress about the bat. He might never be more than a shell of his former self at the plate again. However, at the age of 32, he might also be as good as ever in the field. This alone will continue to make him a plug-and-play option for Craig Counsell moving forward. View full article
-
 There’s been a lot of consternation about Dansby Swanson this year, and rightfully so. He has been really bad at the plate, after all. Heading into their late-June series against the New York Mets, his wRC+, which is an all-encompassing offensive statistic where 100 is average, sits at just 77, according to FanGraphs. Not only does this mean that he is 23 percent worse than the league-average hitter, but this ranks him as the 16th-worst qualified hitter in baseball. Like I said, he's been really bad at the plate. The thing with Swanson is that offense has never been his calling card. Even at his absolute best, the Chicago Cubs’ shortstop has never been any more more than a slightly above-average hitter. His ability to play exceptional defense at a premium position like shortstop is what has made him one of the most valuable players in baseball throughout the course of the 2020s. Until last year, that is. Per Baseball Savant, Swanson was worth two runs above average in the field last season. That was his worst defensive season since 2019. What was different? Swanson went from being elite to merely good at coming in on the ball, while also falling from above average to below average at moving laterally: Year Coming In (OAA) Lateral toward 3B (OAA) Lateral toward 1B (OAA) Going Back (OAA) 2024 14 2 2 -1 2025 9 -1 -2 -1 The values in the table represent the outs above average on each respective play type. At his defensive peak from 2022 to 2023, Swanson was not only elite at coming in on the ball, but also at moving towards third base: he was worth 12 outs above average moving towards third in 2022, and eight in 2023. This declined significantly in 2024, and all but disappeared in 2025. This year, though, he has been worth four outs above average moving toward third base and we’re only halfway through the season. To put this in simpler terms: he is making more plays in the hole between him and third base than he was last year: TDZObzlfWGw0TUFRPT1fQWdVRkFsTlJWd0FBV2dZQ1VnQUhCZ0JlQUFCUkFBTUFVRllEVmdaV0IxZGRWUUlG.mp4 The former Atlanta Brave has also been worth 0 outs above average on plays towards first base, an improvement over his below-average output in 2025. He’s also maintained a steady performance coming in on the ball, worth five outs above average in that regard. Cobble all of that together and Swanson has been worth seven runs above average and nine outs above average in the field so far this year, both of which are seventh in baseball. This is after being worth two runs above average and four outs above average just last season. Despite being one of the worst qualified hitters in baseball, he has still posted 1.5 fWAR, fifth among the Cubs’ position players and more than Alex Bregman, Nico Hoerner, and Carson Kelly. He is on pace for 3.2 fWAR after posting 3.3 last season. Is this all a glass half full view of Dansby Swanson? Of course it is! But we all need that right now while we stress about the bat. He might never be more than a shell of his former self at the plate again. However, at the age of 32, he might also be as good as ever in the field. This alone will continue to make him a plug-and-play option for Craig Counsell moving forward.
 -
Image courtesy of © Ron Chenoy-Imagn Images I have written about this phenomenon before. Our brains are built to recognize patterns. Close your eyes and picture Nico Hoerner swinging at a pitch. In all likelihood, he is making contact with that pitch in your head, because almost every time he swings, he is making contact with that pitch. Except for when he doesn’t, and it leaves me very confused. I had another one of these moments this past week while watching Chicago Cubs highlights. I didn’t get to watch any of Thursday’s win over the Rockies live because of my full-time job, however, I did get to watch the condensed game. I was happy to see that Alex Bregman hit a home run, even if something about the highlight seemed odd to me: Breggy.mp4 Bregman has found success over his career with a very flat bat path, or as it is known on Baseball Savant, swing path tilt. He typically hits home runs on pitches middle up. With a flat bat path and short swing, Bregman has an easier time getting to those pitches and driving them in the air to the pull side of the field for home runs. It’s incredibly rare to see him go down and get a ball that is that low and power it over the fence. That is usually reserved for hitters with a steeper bat path, like Mike Trout, for example. In fact, according to Baseball Savant, that pitch was the fourth-lowest pitch he has ever hit for a home run, and two of the three examples that were lower were from 2017. That long ball was very much something we haven’t seen very often, and certainly not in more recent memory. We can see that on this chart showing every home run of Bregman’s career. That tiny little bottom right-most blue hex is where the home run against the Rockies was: So, what does this mean going forward? The former Astro has been served a steady diet of breaking balls to this point in the season: 40.2 percent of his pitches seen have been some form of breaking ball. That is the highest mark of his career, and is up from 31.3 percent last season. This has come at the expense of fastballs. Only 50.4 percent of the pitches he has seen have been fastballs, which is down from 57.1 percent last season, and is also the lowest mark of his career. I assume you already know this, since you’re willingly reading an article about baseball, but just in case: When a pitcher throws a breaking ball, they typically want it to end up down in the zone. More breaking balls means more pitches down in the zone, and less pitches up and out over the plate where Bregman prefers them. Pitchers have profited from this strategy, as Bregman is slugging just .281 on breaking balls. Using the new swing timing data at Baseball Savant, we can see that he is way early on breaking balls more often than he was in 2024, when he slugged .479 on those pitches: In 2024, which is in orange, he was on time much more often, which is that big peak in the middle. In 2026, which is in blue, we can see a large blue section that peaks out from behind the orange on the far right. That is bad. Those are the swings where Bregman is disastrously early. This is what that looks like: Breggy 2.mp4 The new Cub said as much himself, telling Patrick Mooney “I am out in front on soft and late on fastballs.” This would certainly back that up. Last week, our own Randy Holt did a deep dive on Bregman, and ultimately concluded he was being way too patient and needed to try to jump at pitches out over the plate more often. That, most certainly, is a solution to this problem. On Thursday, he simply decided to just go down and get the pitch that was thrown to him. If he wants to start doing that instead, that could also work. View full article
-
 I have written about this phenomenon before. Our brains are built to recognize patterns. Close your eyes and picture Nico Hoerner swinging at a pitch. In all likelihood, he is making contact with that pitch in your head, because almost every time he swings, he is making contact with that pitch. Except for when he doesn’t, and it leaves me very confused. I had another one of these moments this past week while watching Chicago Cubs highlights. I didn’t get to watch any of Thursday’s win over the Rockies live because of my full-time job, however, I did get to watch the condensed game. I was happy to see that Alex Bregman hit a home run, even if something about the highlight seemed odd to me: Breggy.mp4 Bregman has found success over his career with a very flat bat path, or as it is known on Baseball Savant, swing path tilt. He typically hits home runs on pitches middle up. With a flat bat path and short swing, Bregman has an easier time getting to those pitches and driving them in the air to the pull side of the field for home runs. It’s incredibly rare to see him go down and get a ball that is that low and power it over the fence. That is usually reserved for hitters with a steeper bat path, like Mike Trout, for example. In fact, according to Baseball Savant, that pitch was the fourth-lowest pitch he has ever hit for a home run, and two of the three examples that were lower were from 2017. That long ball was very much something we haven’t seen very often, and certainly not in more recent memory. We can see that on this chart showing every home run of Bregman’s career. That tiny little bottom right-most blue hex is where the home run against the Rockies was: So, what does this mean going forward? The former Astro has been served a steady diet of breaking balls to this point in the season: 40.2 percent of his pitches seen have been some form of breaking ball. That is the highest mark of his career, and is up from 31.3 percent last season. This has come at the expense of fastballs. Only 50.4 percent of the pitches he has seen have been fastballs, which is down from 57.1 percent last season, and is also the lowest mark of his career. I assume you already know this, since you’re willingly reading an article about baseball, but just in case: When a pitcher throws a breaking ball, they typically want it to end up down in the zone. More breaking balls means more pitches down in the zone, and less pitches up and out over the plate where Bregman prefers them. Pitchers have profited from this strategy, as Bregman is slugging just .281 on breaking balls. Using the new swing timing data at Baseball Savant, we can see that he is way early on breaking balls more often than he was in 2024, when he slugged .479 on those pitches: In 2024, which is in orange, he was on time much more often, which is that big peak in the middle. In 2026, which is in blue, we can see a large blue section that peaks out from behind the orange on the far right. That is bad. Those are the swings where Bregman is disastrously early. This is what that looks like: Breggy 2.mp4 The new Cub said as much himself, telling Patrick Mooney “I am out in front on soft and late on fastballs.” This would certainly back that up. Last week, our own Randy Holt did a deep dive on Bregman, and ultimately concluded he was being way too patient and needed to try to jump at pitches out over the plate more often. That, most certainly, is a solution to this problem. On Thursday, he simply decided to just go down and get the pitch that was thrown to him. If he wants to start doing that instead, that could also work.
 -
Image courtesy of © Matt Marton-Imagn Images I don’t know about you, but I woke up on Friday with a new sense of vigor around the Chicago Cubs. I am not really a believer in momentum when it comes to sports. At the same time, Thursday was a massive come-from-behind win for the struggling club. Edward Cabrera was set to return on Friday to fortify a starting rotation badly in need of reinforcements. Plus, the Giants, one of the worst teams in baseball, were coming in to play three games at Wrigley Field. This was the perfect storm to right the ship. It didn’t take long for that vigor to disappear. A rain delay, coupled with the Giants immediately taking a 2-0 lead, put a small dent in my psyche. Then, a Matt Chapman grand slam in the fourth inning completely obliterated my excitement, and suddenly, I found myself watching college baseball instead. Cabrera, who was returning from a stint on the injured list with a blister, ended up with his worst line as a Cub: 3.2 innings pitched and eight earned runs given up on eight hits and three home runs. I am not going to sit here and tell you that Cabrera was actually good in this game. What I will do is give you a “the glass is one percent full” spin on the matter. The right hander’s strikeout rate on the day was 30 percent, and that is his single highest strikeout rate in any game this season. Where did those extra strikeouts come from? Well, for one, his velocity was up considerably from where it has been all season. All stats via FanGraphs: Fastball Velocity Sinker Velocity Slider Velocity Curveball Velocity Changeup Velocity Season Average (Before IL stint) 95.7 mph 95.9 mph 88.5 mph 84.5 mph 92.6 mph 6/5 vs. Giants 97.3 mph 96.9 mph 90.4 mph 86.5 mph 93.8 mph That is a full one or two ticks on every pitch that Cabrera throws. His Stuff+ ratings, which measure the physical characteristics of a pitch, increased accordingly. For this start, his Stuff+ rating of 99 was bested only by his April 28 start earlier this season. This is what makes Cabrera so tantalizing. When he is on, he is getting Matt Chapman to swing through a beautifully executed slider: cabrera.mp4 And following that up with a changeup that breaks the opposite direction from the slider: cabrera 1.mp4 So, what was Cabrera’s issue on Friday? According to FanGraphs, he threw first pitch strikes on just 35 percent of his plate appearances. That’s his lowest rate this season by over 10 percentage points. Prior to Friday’s start, hitters were slugging .493 on pitches from Cabrera in the strike zone, per Baseball Savant. Over 14 percent of those balls in play were barreled, i.e. balls that were hit with an ideal combination of exit velocity and launch angle. On Friday? Hitters slugged 1.286 on pitches in the zone and 27.3 percent of those balls in play were barreled. Cabrera simply was falling behind way too many hitters, and when he came into the zone, they were ready for it. If we’re looking for a bright side, and we all know that we desperately need it, I’d say that it’s clear Cabrera is healthy. The increased velocity says to me that he is feeling no ill effects from his blister. Still, he was acquired to be better than this. Whether it’s because he was falling behind hitters or not, he has to get better results when he pitches in the strike zone. The stuff is there. The results, like everything else for the Cubs right now, really lagged behind on Friday. View full article
-
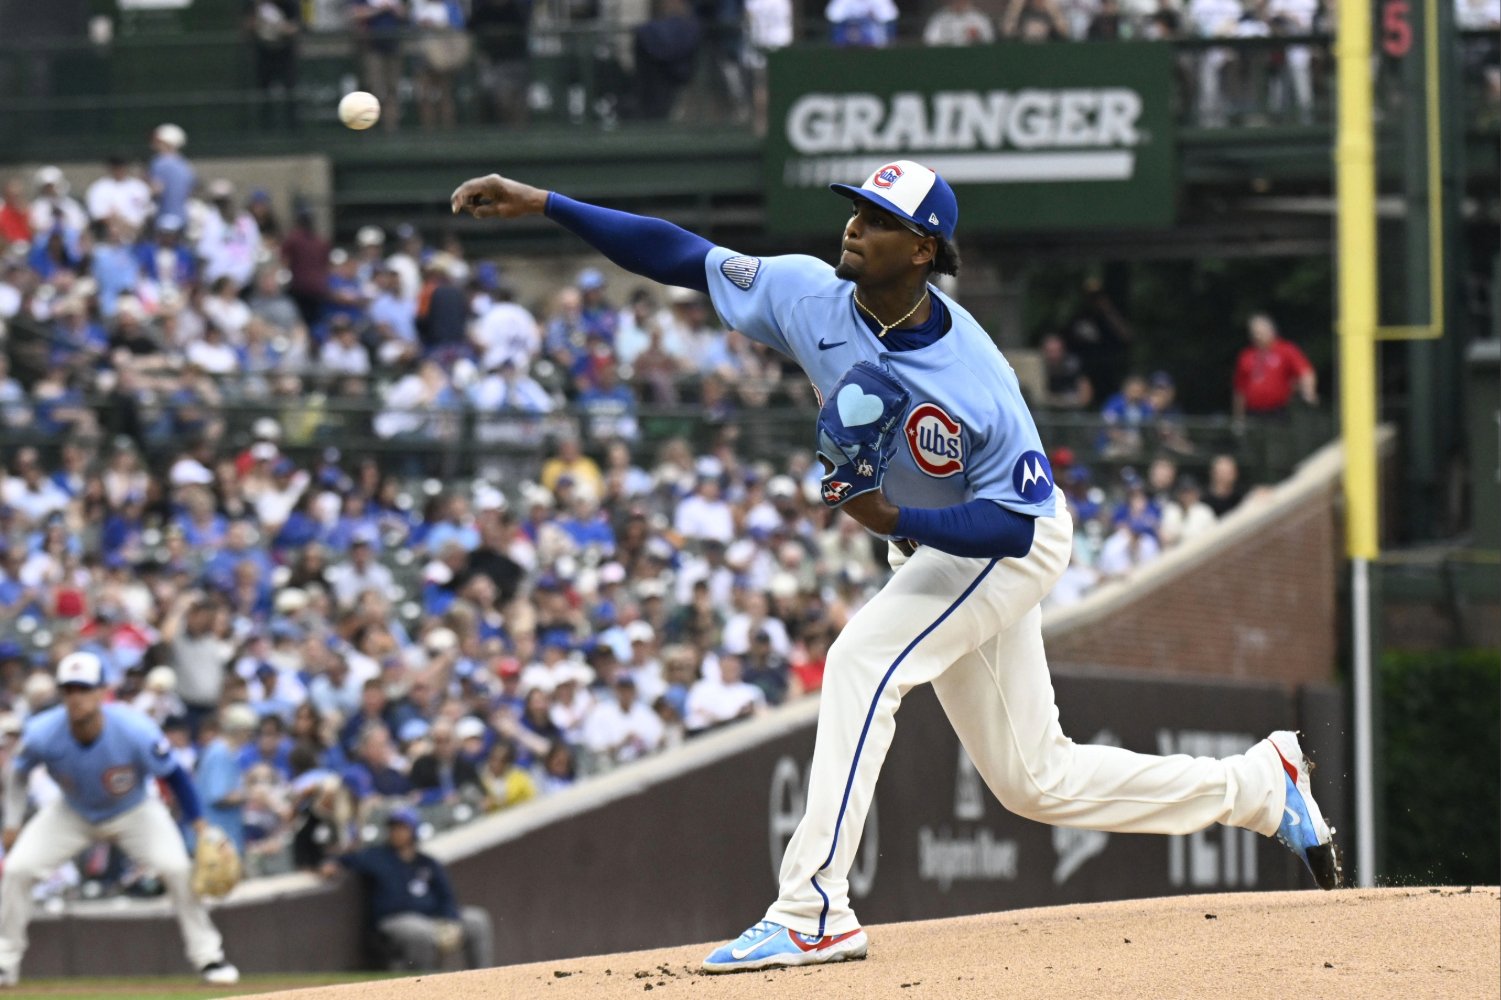 I don’t know about you, but I woke up on Friday with a new sense of vigor around the Chicago Cubs. I am not really a believer in momentum when it comes to sports. At the same time, Thursday was a massive come-from-behind win for the struggling club. Edward Cabrera was set to return on Friday to fortify a starting rotation badly in need of reinforcements. Plus, the Giants, one of the worst teams in baseball, were coming in to play three games at Wrigley Field. This was the perfect storm to right the ship. It didn’t take long for that vigor to disappear. A rain delay, coupled with the Giants immediately taking a 2-0 lead, put a small dent in my psyche. Then, a Matt Chapman grand slam in the fourth inning completely obliterated my excitement, and suddenly, I found myself watching college baseball instead. Cabrera, who was returning from a stint on the injured list with a blister, ended up with his worst line as a Cub: 3.2 innings pitched and eight earned runs given up on eight hits and three home runs. I am not going to sit here and tell you that Cabrera was actually good in this game. What I will do is give you a “the glass is one percent full” spin on the matter. The right hander’s strikeout rate on the day was 30 percent, and that is his single highest strikeout rate in any game this season. Where did those extra strikeouts come from? Well, for one, his velocity was up considerably from where it has been all season. All stats via FanGraphs: Fastball Velocity Sinker Velocity Slider Velocity Curveball Velocity Changeup Velocity Season Average (Before IL stint) 95.7 mph 95.9 mph 88.5 mph 84.5 mph 92.6 mph 6/5 vs. Giants 97.3 mph 96.9 mph 90.4 mph 86.5 mph 93.8 mph That is a full one or two ticks on every pitch that Cabrera throws. His Stuff+ ratings, which measure the physical characteristics of a pitch, increased accordingly. For this start, his Stuff+ rating of 99 was bested only by his April 28 start earlier this season. This is what makes Cabrera so tantalizing. When he is on, he is getting Matt Chapman to swing through a beautifully executed slider: cabrera.mp4 And following that up with a changeup that breaks the opposite direction from the slider: cabrera 1.mp4 So, what was Cabrera’s issue on Friday? According to FanGraphs, he threw first pitch strikes on just 35 percent of his plate appearances. That’s his lowest rate this season by over 10 percentage points. Prior to Friday’s start, hitters were slugging .493 on pitches from Cabrera in the strike zone, per Baseball Savant. Over 14 percent of those balls in play were barreled, i.e. balls that were hit with an ideal combination of exit velocity and launch angle. On Friday? Hitters slugged 1.286 on pitches in the zone and 27.3 percent of those balls in play were barreled. Cabrera simply was falling behind way too many hitters, and when he came into the zone, they were ready for it. If we’re looking for a bright side, and we all know that we desperately need it, I’d say that it’s clear Cabrera is healthy. The increased velocity says to me that he is feeling no ill effects from his blister. Still, he was acquired to be better than this. Whether it’s because he was falling behind hitters or not, he has to get better results when he pitches in the strike zone. The stuff is there. The results, like everything else for the Cubs right now, really lagged behind on Friday.
 -
Image courtesy of © Jeff Le-Imagn Images Believe it or not, there were some bright spots in what was a really ugly month of May for the Chicago Cubs. A 13-16 record yielded a lot of questions about the offense, and it was that offensive underperformance that perhaps allowed the pitching to slip under the radar a little bit. To be clear, the offense wasn’t great, but a 4.42 ERA for the team sure didn’t help matters either. With that out of the way, though, let’s revel in those aforementioned bright spots for a bit and take a look at the pitchers of the month for May of 2026. 3. Ethan Roberts: 9 G, 2.03 ERA, 13.1 IP, 7 BB, 10 K I love any baseball player that is a little bit different. At 5-foot-10 and 180 pounds, Roberts doesn't look like a typical professional pitcher. The 19.6% strikeout rate in the month of May would support that he simply is not the typical professional pitcher. Roberts has always walked a tightrope from atop the rubber. Not striking a lot of guys out means that you have to manage contact really well. After having been a fly ball pitcher for most of his first few brief seasons in the majors, Roberts has suddenly turned into a ground-ball machine, with a ground-ball rate of 64.7% in May, according to FanGraphs. This is after never posting a ground-ball rate above 36.4% in any full season in his career. He won’t maintain a .235 batting average on balls in play. Nobody does. We already saw some of that come back to earth in his outing Sunday against the Cardinals, when a bloop double found grass and denied him what could have been a big escape from a jam. But if the ground-ball rate remains that high, he just might be able to remain a viable option in the bullpen. The Cubs really need it. 2. Jacob Webb: 12 G, 0.64 ERA, 14 IP, 3 BB, 19 K Matthew Trueblood wrote about Webb here at Northside Baseball just last week. He concluded that Webb has dialed in the location on his changeup, which has unlocked him as a relief ace for the Cubs. Webb’s numbers in May certainly support this. According to Baseball Savant, hitters slugged .611 against his changeup in March and April. They had a 30% hard hit rate (a ball hit with an exit velocity of 95 mph or higher), and they whiffed on 42.9% of their swings. In May, hitters slugged just .167 to go along with a hard hit rate of 15.4%, and a whiff rate of 52.7%. That’ll certainly contribute to a month where a pitcher strikes out 19 guys and walks only three. 1. Ben Brown: 7 G, 1.86 ERA, 29 IP, 8 BB, 31 K A lot has been written about Brown at Northside Baseball as well, and for good reason: he is one of the only good things going for the Cubs at the moment. He was inserted into the rotation out of necessity on May 8, and has responded by being the team’s best starting pitcher for the month ,by a mile. Jeremy Tecktiel recently wrote about how Brown’s new sinker has turned him into a ground ball pitcher. Similar to Roberts, that is a huge development for Brown, especially given he has managed to continue to strike hitters out at an above average rate. Since we’ve written about the sinker, I would like to take a moment to acknowledge Brown’s changeup, which was thrown 4% of the time in March and April, and increased to 8.8% in May, per Baseball Savant. Hitters hit just .111 and slugged .222 against the pitch in May, while whiffing on 46.7% of swings. It’s been more than just a “third time through the order pitch,” too. Here he is fooling Brandon Nimmo with a perfect changeup on just the second pitch of a start in Texas: NXk5Z1BfWGw0TUFRPT1fQUFaVlVsTlNWd2NBWGxNQUJ3QUhCZzlYQUZrQ1ZBQUFBbFVHVWxWUkIxVUVWQWRU.mp4 It’s been a long time coming for Brown, and it finally seems to be coming together. With all of the injuries the pitching staff has dealt with so far this year, the timing couldn’t have been better for the Cubs. Congrats to Ben Brown on being the Cubs’ pitcher of the month for May. They might need him to win this quasi-award again in June. View full article


