.jpg.900f6d1bc80a5a156f3ba09ea0e4b3d7.jpg)

Jason Ross
-
Posts
7,381 -
Joined
-
Last visited
-
Days Won
59
Content Type
Profiles
Joomla Posts 1
Chicago Cubs Videos
Chicago Cubs Free Agent & Trade Rumors, Notes, & Tidbits
2026 Chicago Cubs Top Prospects Ranking
News
2023 Chicago Cubs Draft Picks
Guides & Resources
2024 Chicago Cubs Draft Picks
The Chicago Cubs Players Project
2025 Chicago Cubs Draft Pick Tracker
2026 Chicago Cubs Draft Tracker: Picks & Bonuses
Blogs
Events
Forums
Store
Gallery
Everything posted by Jason Ross
-
Cubs 2025 Season Review/Offseason Preview Thread
Jason Ross replied to Brandon Glick's topic in Chicago Cubs Talk
Valdez seems like a turd. He threw at this own catcher last year (he can claim he didn't; he obviously did). In terms of 2026, he might be a star pitcher in front of our defense. Beyond that, I'm very uninterested. -
Tatsuya Imai Might Be the Pitcher the Cubs Break the Free Agent Bank For
Jason Ross posted an article in Cubs
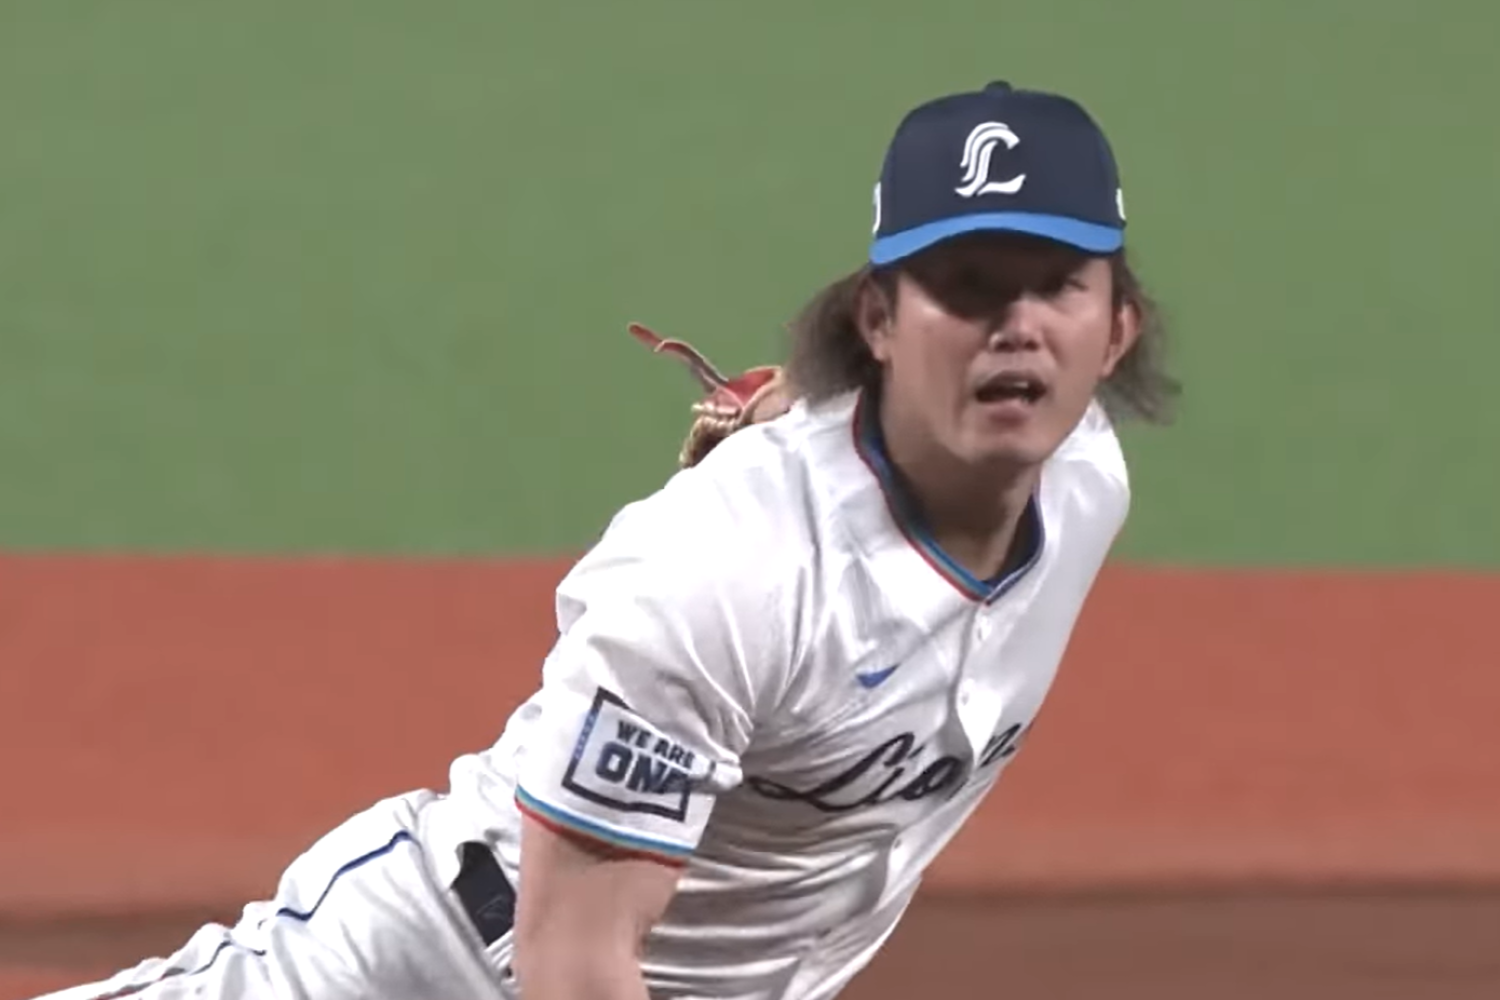 The Chicago Cubs ended their 2025 campaign with a game started by Drew Pomeranz. There was a time (before the Covid-19 pandemic) when that sentence wouldn't have seemed crazy, but that was also the last time that it wouldn't have. Since then, Pomeranz has transitioned from a starting pitcher to strictly a two-pitch reliever. Shota Imanaga, who was on regular rest, spent the entire game in the bullpen. There are many reasons the Cubs didn’t win the World Series in 2025, but their loss in Game 5 was truly a microcosm of what was wrong with the roster. They were one pitcher short, relying too much on a bullpen to hide the deficiencies of their rotation.. Jed Hoyer, in his end-of-year press conference, essentially admitted as much, speaking of how difficult it was for the team to make the additions they wished they could at the deadline. This will have change as the team looks to build on their 92-win season in 2026. Luckily for the Cubs, there are many options on the market. If they would like to attack the free-agent class, top-line arms such as Framber Valdez, Dylan Cease and Ranger Suárez are all available to be signed while surrendering draft-pick compensation. If they don't love any of these options, they could look to the trade market, hoping that the prices on Joe Ryan, MacKenzie Gore or Edward Cabrera have come down. Instead, though, the Cubs may look to a place they have looked multiple times in the last few seasons: across the Pacific Ocean, to Japan. Enter: Tatsuya Imai, a 27-year-old right-handed pitcher from Japan's top flight, Nippon Professional Baseball. Imai's club, the Seibu Lions, have confirmed their intentions to allow the pitcher to come to America this offseason. His agent, Scott Boras, said Wednesday that the hurler will officially be posted on November 19, which is next Wednesday. Imai is likely to have plenty of suitors, and his contract is expected to rival those in the top tier of free agency, with The Athletic predicting he will earn north of $140 million. The Cubs have not been a team we associate with big-time free-agent contracts in recent years, but I think the righty may be the type of player the Cubs will be willing to break the bank on. To understand why the Cubs may target Imai, we need to first understand what the Cubs rotation lacks: strikeouts. In terms of ERA, the Cubs finished in the top 10, but they were 23rd in strikeout rate. Chicago’s defense is excellent, but adding more swing-and-miss would give the team’s run prevention a needed boost, and the Japanese star would certainly do that. He struck out 27.8% of all hitters and over 31% of righties in 2025. Ben Brown is the only Cub who made more than five starts with the team and struck out even 25% of opposing hitters. There is a caveat. Imai's fastball isn't going to be nearly as special in terms of velocity when he comes over. However, I don't think this will scare off the Cubs. To put it in context, in NPB, Imai had the second-fastest fastball in the league, clocking in around the 95-mph mark and touching 99 on occasion. When he comes over, though, his fastball will be around average for a right-handed starter in Major League Baseball, which was 94.6 mph last year. The good news for Imai is that his arm angle is funky, which should allow him to create deception. While NPB does not make arm angle public on their tracking site, it's likely that his angle will put him around the flattest in baseball. Compare the above video of Imai to the below video of Seattle Mariners' starter Bryan Woo. Woo clocks in around a 23° arm angle, the 12th-flattest of any starter in 2025. I expect Imai to be in that range. Uk8yeU5fWGw0TUFRPT1fVUFVSFZGUUhYd2NBWEFSVUFBQUhBVkFFQUZrRFUxa0FVRlVNVWxJRlV3b0RVVkZR.mp4 While I hesitate to compare the two directly in terms of fastball value, Woo's fastball sat at 95.6 mph last year. And while the shape of Woo's fastball is good, grading out on FanGraphs's Stuff+ as a 105, on shape and velocity alone, it falls short of elite. Despite that, Woo's fastball performs among the best in the league. It's pretty well-known that the Cubs, who threw the most four-seam fastballs of any team in 2025, value the pitch highly. While we shouldn’t expect Imai to duplicate Woo’s success with the four-seam fastball, it also wouldn’t be surprising to see the Cubs attempt to use Woo as a template for what can be done. The Cubs have managed to squeeze extra velocity out of a few arms in their system over the years, and when you add year two of Tyler Zombro and everything Tread Athletics can do, it gives the Cubs a strong foundation to help get the most out of him. Imai may never dominate on velocity alone, but I think there’s potential for the pitch with a good fastball organization, like the Cubs. Imai’s most unique offering is his "slider". I'm going to be careful what I call it, though. It's not really a slider, at least in the traditional sense, because Imai throws his with arm-side run. This effectively makes it a “reverse” breaking ball, or screwball, running toward a right-handed batter instead of away from them (as most righties’ sliders do). I suspect that Stuff+ models will hate the pitch, but the results in Japan were stunning. The slider generated a 45.9% swing-and-miss rate, which would have placed it in the top 10 in whiff rate in MLB. It's fair to wonder how the pitch will play against American big-league hitters due to its unique nature, but if there's one thing I'm confident about, it’s that the Cubs aren't afraid of a funky pitch. Due to his slider-fastball combination, Imai has been absolutely deadly against right handed hitters. On the surface, this makes sense; both of these pitches play up against like-handed hitters before we factor in the funk factor of his delivery or slider profile. Beyond that, it would appear as though he added a sinker to his repertoire late in the season—yet another pitch that will help him navigate the best righty batters in the world. It’s great to have all of these offerings, but there’s a drawback; none of these pitches are great against left-handed hitters, and this has been a general Achilles heel for him over his career in NPB. One of the hallmarks of the Cubs pitching staff in 2025 was their on-the-fly development of changeups, a pitch often used to attack opposite-handed hitters. Both Cade Horton and Jameson Taillon, who badly needed an extra offering, developed very strong kick-changes before or during the 2025 season. It wouldn't appear as though Imai would be a direct candidate for the kick-change like the other two, as he tends to be more of a pronator to begin with. (The kick-change, which involves using the placement of the middle finger to "kick" the spin axis sideways as the ball comes off the fingers, has usually been a tool employed by pitchers who tend to supinate and specialize in glove-side movement.) Despite that, an organization who can continue to get the best ot his changeup is likely the organization willing to spend big on the pitcher to begin with. Before 2025, Imai had terrible walk issues with lefties, specifically, walking 11% of them in 2024. He developed a better changeup in 2025, which dropped his walk rate against lefties to 8.5% and allowed him to make major strides in terms of run prevention against them. The Cubs, an organization that excels at teaching the changeup, would continue to work with the pitcher to solve this issue. It's likely that this isn't entirely behind him, as the step up in competition will push him to his limits. I don't think that the overall package that Imai has today puts him in the same tier as Yoshinobu Yamamoto was when he came over from NPB two offseasons ago; I don't think anyone does. Even the priciest predictions have Imai making around half of the $325 million that Yamamoto got from the Dodgers. But he's also a clear step above what Shota Imanaga was when the Cubs signed him, and he's proven capable of being somewhere between a second starter and a fourth-best option. I wouldn't expect Imai to headline a rotation, but I do think there's more than enough clay to mold a front-line option. There are probably going to be some tweaks. Imai's fastball location leaves something to be desired; the changeup is just starting out and likely needs refinement; and it will take a good organization to best use Imai's funky reverse slider. Still, I think he fits into how the Cubs view pitchers. They love four-seam fastballs, lower arm slots, changeups and funk. Imai fits Chicago in other ways, too. The Cubs have been active in scouting Japanese players under Hoyer. They have signed both Seiya Suzuki and Imanaga. They have been major players, regardless of outcome, when it comes to Shohei Ohtani and Roki Sasaki. They have even reportedly offered a contract to 22-year-old, undrafted NPB outfielder Kotaru Tsunematsu (though we are unsure if he's accepted as of writing this article, and he seems as likely to become a force in their front office someday as to blossom on the field). He's also the right age for this kind of investment. Pitchers rarely hit the market at the age of 27. While the Cubs have shied away from big contracts, their two biggest signings of the last decade were offered to 26-year-old Jason Heyward and 29-year-old Dansby Swanson. Pitchers are aging better than hitters lately, too. Will Imai end up in Chicago? It’s no sure thing. The New York Mets are interested, and have recently signed Kodai Senga. The New York Yankees are always a premium destination and are looking for pitchers. There will be plenty of competition. But I also feel like this is a unique situation in which the pitcher's style aligns with much of what the Cubs like. Coming over from Japan, there is no draft-pick compensation attached, which is likely a factor for the Cubs. Taking all these factors in conjunction, I think the Cubs are going to put him very high on their offseason list. If the Cubs are going to spend $150 million on a player, Imai is probably the type they are willing to look at.
 -
Image courtesy of Pacific League TV/YouTube The Chicago Cubs ended their 2025 campaign with a game started by Drew Pomeranz. There was a time (before the Covid-19 pandemic) when that sentence wouldn't have seemed crazy, but that was also the last time that it wouldn't have. Since then, Pomeranz has transitioned from a starting pitcher to strictly a two-pitch reliever. Shota Imanaga, who was on regular rest, spent the entire game in the bullpen. There are many reasons the Cubs didn’t win the World Series in 2025, but their loss in Game 5 was truly a microcosm of what was wrong with the roster. They were one pitcher short, relying too much on a bullpen to hide the deficiencies of their rotation.. Jed Hoyer, in his end-of-year press conference, essentially admitted as much, speaking of how difficult it was for the team to make the additions they wished they could at the deadline. This will have change as the team looks to build on their 92-win season in 2026. Luckily for the Cubs, there are many options on the market. If they would like to attack the free-agent class, top-line arms such as Framber Valdez, Dylan Cease and Ranger Suárez are all available to be signed while surrendering draft-pick compensation. If they don't love any of these options, they could look to the trade market, hoping that the prices on Joe Ryan, MacKenzie Gore or Edward Cabrera have come down. Instead, though, the Cubs may look to a place they have looked multiple times in the last few seasons: across the Pacific Ocean, to Japan. Enter: Tatsuya Imai, a 27-year-old right-handed pitcher from Japan's top flight, Nippon Professional Baseball. Imai's club, the Seibu Lions, have confirmed their intentions to allow the pitcher to come to America this offseason. His agent, Scott Boras, said Wednesday that the hurler will officially be posted on November 19, which is next Wednesday. Imai is likely to have plenty of suitors, and his contract is expected to rival those in the top tier of free agency, with The Athletic predicting he will earn north of $140 million. The Cubs have not been a team we associate with big-time free-agent contracts in recent years, but I think the righty may be the type of player the Cubs will be willing to break the bank on. To understand why the Cubs may target Imai, we need to first understand what the Cubs rotation lacks: strikeouts. In terms of ERA, the Cubs finished in the top 10, but they were 23rd in strikeout rate. Chicago’s defense is excellent, but adding more swing-and-miss would give the team’s run prevention a needed boost, and the Japanese star would certainly do that. He struck out 27.8% of all hitters and over 31% of righties in 2025. Ben Brown is the only Cub who made more than five starts with the team and struck out even 25% of opposing hitters. There is a caveat. Imai's fastball isn't going to be nearly as special in terms of velocity when he comes over. However, I don't think this will scare off the Cubs. To put it in context, in NPB, Imai had the second-fastest fastball in the league, clocking in around the 95-mph mark and touching 99 on occasion. When he comes over, though, his fastball will be around average for a right-handed starter in Major League Baseball, which was 94.6 mph last year. The good news for Imai is that his arm angle is funky, which should allow him to create deception. While NPB does not make arm angle public on their tracking site, it's likely that his angle will put him around the flattest in baseball. Compare the above video of Imai to the below video of Seattle Mariners' starter Bryan Woo. Woo clocks in around a 23° arm angle, the 12th-flattest of any starter in 2025. I expect Imai to be in that range. Uk8yeU5fWGw0TUFRPT1fVUFVSFZGUUhYd2NBWEFSVUFBQUhBVkFFQUZrRFUxa0FVRlVNVWxJRlV3b0RVVkZR.mp4 While I hesitate to compare the two directly in terms of fastball value, Woo's fastball sat at 95.6 mph last year. And while the shape of Woo's fastball is good, grading out on FanGraphs's Stuff+ as a 105, on shape and velocity alone, it falls short of elite. Despite that, Woo's fastball performs among the best in the league. It's pretty well-known that the Cubs, who threw the most four-seam fastballs of any team in 2025, value the pitch highly. While we shouldn’t expect Imai to duplicate Woo’s success with the four-seam fastball, it also wouldn’t be surprising to see the Cubs attempt to use Woo as a template for what can be done. The Cubs have managed to squeeze extra velocity out of a few arms in their system over the years, and when you add year two of Tyler Zombro and everything Tread Athletics can do, it gives the Cubs a strong foundation to help get the most out of him. Imai may never dominate on velocity alone, but I think there’s potential for the pitch with a good fastball organization, like the Cubs. Imai’s most unique offering is his "slider". I'm going to be careful what I call it, though. It's not really a slider, at least in the traditional sense, because Imai throws his with arm-side run. This effectively makes it a “reverse” breaking ball, or screwball, running toward a right-handed batter instead of away from them (as most righties’ sliders do). I suspect that Stuff+ models will hate the pitch, but the results in Japan were stunning. The slider generated a 45.9% swing-and-miss rate, which would have placed it in the top 10 in whiff rate in MLB. It's fair to wonder how the pitch will play against American big-league hitters due to its unique nature, but if there's one thing I'm confident about, it’s that the Cubs aren't afraid of a funky pitch. Due to his slider-fastball combination, Imai has been absolutely deadly against right handed hitters. On the surface, this makes sense; both of these pitches play up against like-handed hitters before we factor in the funk factor of his delivery or slider profile. Beyond that, it would appear as though he added a sinker to his repertoire late in the season—yet another pitch that will help him navigate the best righty batters in the world. It’s great to have all of these offerings, but there’s a drawback; none of these pitches are great against left-handed hitters, and this has been a general Achilles heel for him over his career in NPB. One of the hallmarks of the Cubs pitching staff in 2025 was their on-the-fly development of changeups, a pitch often used to attack opposite-handed hitters. Both Cade Horton and Jameson Taillon, who badly needed an extra offering, developed very strong kick-changes before or during the 2025 season. It wouldn't appear as though Imai would be a direct candidate for the kick-change like the other two, as he tends to be more of a pronator to begin with. (The kick-change, which involves using the placement of the middle finger to "kick" the spin axis sideways as the ball comes off the fingers, has usually been a tool employed by pitchers who tend to supinate and specialize in glove-side movement.) Despite that, an organization who can continue to get the best ot his changeup is likely the organization willing to spend big on the pitcher to begin with. Before 2025, Imai had terrible walk issues with lefties, specifically, walking 11% of them in 2024. He developed a better changeup in 2025, which dropped his walk rate against lefties to 8.5% and allowed him to make major strides in terms of run prevention against them. The Cubs, an organization that excels at teaching the changeup, would continue to work with the pitcher to solve this issue. It's likely that this isn't entirely behind him, as the step up in competition will push him to his limits. I don't think that the overall package that Imai has today puts him in the same tier as Yoshinobu Yamamoto was when he came over from NPB two offseasons ago; I don't think anyone does. Even the priciest predictions have Imai making around half of the $325 million that Yamamoto got from the Dodgers. But he's also a clear step above what Shota Imanaga was when the Cubs signed him, and he's proven capable of being somewhere between a second starter and a fourth-best option. I wouldn't expect Imai to headline a rotation, but I do think there's more than enough clay to mold a front-line option. There are probably going to be some tweaks. Imai's fastball location leaves something to be desired; the changeup is just starting out and likely needs refinement; and it will take a good organization to best use Imai's funky reverse slider. Still, I think he fits into how the Cubs view pitchers. They love four-seam fastballs, lower arm slots, changeups and funk. Imai fits Chicago in other ways, too. The Cubs have been active in scouting Japanese players under Hoyer. They have signed both Seiya Suzuki and Imanaga. They have been major players, regardless of outcome, when it comes to Shohei Ohtani and Roki Sasaki. They have even reportedly offered a contract to 22-year-old, undrafted NPB outfielder Kotaru Tsunematsu (though we are unsure if he's accepted as of writing this article, and he seems as likely to become a force in their front office someday as to blossom on the field). He's also the right age for this kind of investment. Pitchers rarely hit the market at the age of 27. While the Cubs have shied away from big contracts, their two biggest signings of the last decade were offered to 26-year-old Jason Heyward and 29-year-old Dansby Swanson. Pitchers are aging better than hitters lately, too. Will Imai end up in Chicago? It’s no sure thing. The New York Mets are interested, and have recently signed Kodai Senga. The New York Yankees are always a premium destination and are looking for pitchers. There will be plenty of competition. But I also feel like this is a unique situation in which the pitcher's style aligns with much of what the Cubs like. Coming over from Japan, there is no draft-pick compensation attached, which is likely a factor for the Cubs. Taking all these factors in conjunction, I think the Cubs are going to put him very high on their offseason list. If the Cubs are going to spend $150 million on a player, Imai is probably the type they are willing to look at. View full article
-
Cubs 2025 Season Review/Offseason Preview Thread
Jason Ross replied to Brandon Glick's topic in Chicago Cubs Talk
To be fair to the Cubs here as well, though, if we're going to say "Hottovy works magic" than we have to remember this; advanced metrics don't like the Cubs pitching as much either. They were top-10 in ERA and 18th in xFIP on the whole. Part of that is because of their defense, but I think it's kind of a self fulfilling prophecy; if we believe the Cubs are good at getting more out of players (young players like Amaya or mediocre pitchers like Colin Rea) than they probably will out perform their advanced metrics. I don't want to beat a dead horse here or make it a longer discussion than needs to be - only saying that I don't mind that the Cubs have identified pitching as their primary need. In a perfect world, I would trust the Cubs to spend money on Kyle Schwarber on a five year deal and if/when it got ugly, would just move on from it and use their financial advantage, but sadly, I just don't. The Cubs will probably always need to be more careful than they should need to be in how they spend. And because of that, I'd rather them just go in on the players I feel most comfortable with when it comes to meeting their contractual value. -
Yeah, I just don't think that's a good idea on his part.
-
Heyman; Shota expected to decline QO.
-
Cubs 2025 Season Review/Offseason Preview Thread
Jason Ross replied to Brandon Glick's topic in Chicago Cubs Talk
So, I'll push back on few things: 1. I don't know we lost our best hitter. Michael Busch finished the season with a 140 wRC+. Kyle Tucker finished the year with a 136 wRC+(career 138 wRC+). It's certainly possible we saw the best season Michael Busch can or will ever have - but he made a lot of progress with the swing and even against LHP. And while we have seen Kyle Tucker go bananas for stints, we haven't seen him really be consistently better than 140 wRC+, either. I'm not saying Busch is our best hitter, but like, it isn't as if the Cubs were a one man show. This isn't me saying "it's okay to let him go" or "Kyle Tucker won't be missed" but that I think we forget how good Busch (140 wRC+) was. 2. The Cubs, even without Kyle Tucker, project to be average or better than average at every position on the diamond right now except for DH. They also are very much a team with a glut of offensive prospects - they shouldn't keep them all and hoard them, but we should feel fairly confident in their ability to pick one of them and turn them into a good MLB regular. They've consistently done this the last few years, they get a benefit of the doubt here. So while you've brought up Hottovy and the Cubs pitching infrastructure, it's also fair to remember all of the progress we have made developing young hitters. Pete Crow-Armstrong, Matt Shaw, Miguel Amaya and Michael Busch have seen big strides with their swings over just the last two years. If the Cubs choose to go with with a rookie there is also a reason to believe that they can get the most out of them, much like Hottovy could get the most out of an under the radar arm. 3. I'm not going to defend the Cubs if they walk into the season with a $175m payroll adding a down-year Michael King, building a cheap ass BP and ignoring the offense. But I think the payroll concerns don't match with how the Cubs have behaved. They're cheap in that they clearly care most about profits, don't spend to their ability and don't want to break the bank on great players but they've never been "win 92 games and then drop to the 17th (in 2025) best payroll" cheap, either (unless we count 2020 into 2021 but I think the Pandemic was the root cause and there has was no recent pandemic). I wouldn't expect them to blow past an LT, but I do expect they'll get to around the same payroll. I also don't expect they'll ignore the offense entirely. But I do think what we're hearing over and over is that the Cubs priority is pitching, and as @Bertz showed, it's their obvious issue. -
Cubs 2025 Season Review/Offseason Preview Thread
Jason Ross replied to Brandon Glick's topic in Chicago Cubs Talk
You doom boner it up. I don't take it as bad. Like I said to you, I'm not super in love with this class of bats. I think if the Cubs are thinking in terms of just Uber loading up on pitching, this is perfectly fine if they also don't love these hitters. Obviously that calls on you to believe their comments. They did say they'd look at all levels of the FA market and trade market for arms. They talked about the pitching at the end of year presser. So I do believe that they're definitely interested in pitching. Will they get a little irrational and get Cease or Imai? Or will they instead do a Ponce, King off-season and call her quits? -
Cubs 2025 Season Review/Offseason Preview Thread
Jason Ross replied to Brandon Glick's topic in Chicago Cubs Talk
Sub 2.00 ERA in Korea last year. Struck out 36% of hitters faced. Fastball sits mid 90s and can tick up. Heard the control comes and goes gets a little too challenge heavy. His numbers in KBO were the in Merrill Kelly territory and he turned into a good SP after a KBO stint. I think a good org gets him to a mid rotation arm. But there is BP risk. And nothing is for sure. -
Cubs 2025 Season Review/Offseason Preview Thread
Jason Ross replied to Brandon Glick's topic in Chicago Cubs Talk
-
Per Levine: Cubs and Shota could work out 2 year extension either before he accepts QO or after he declines it.
-
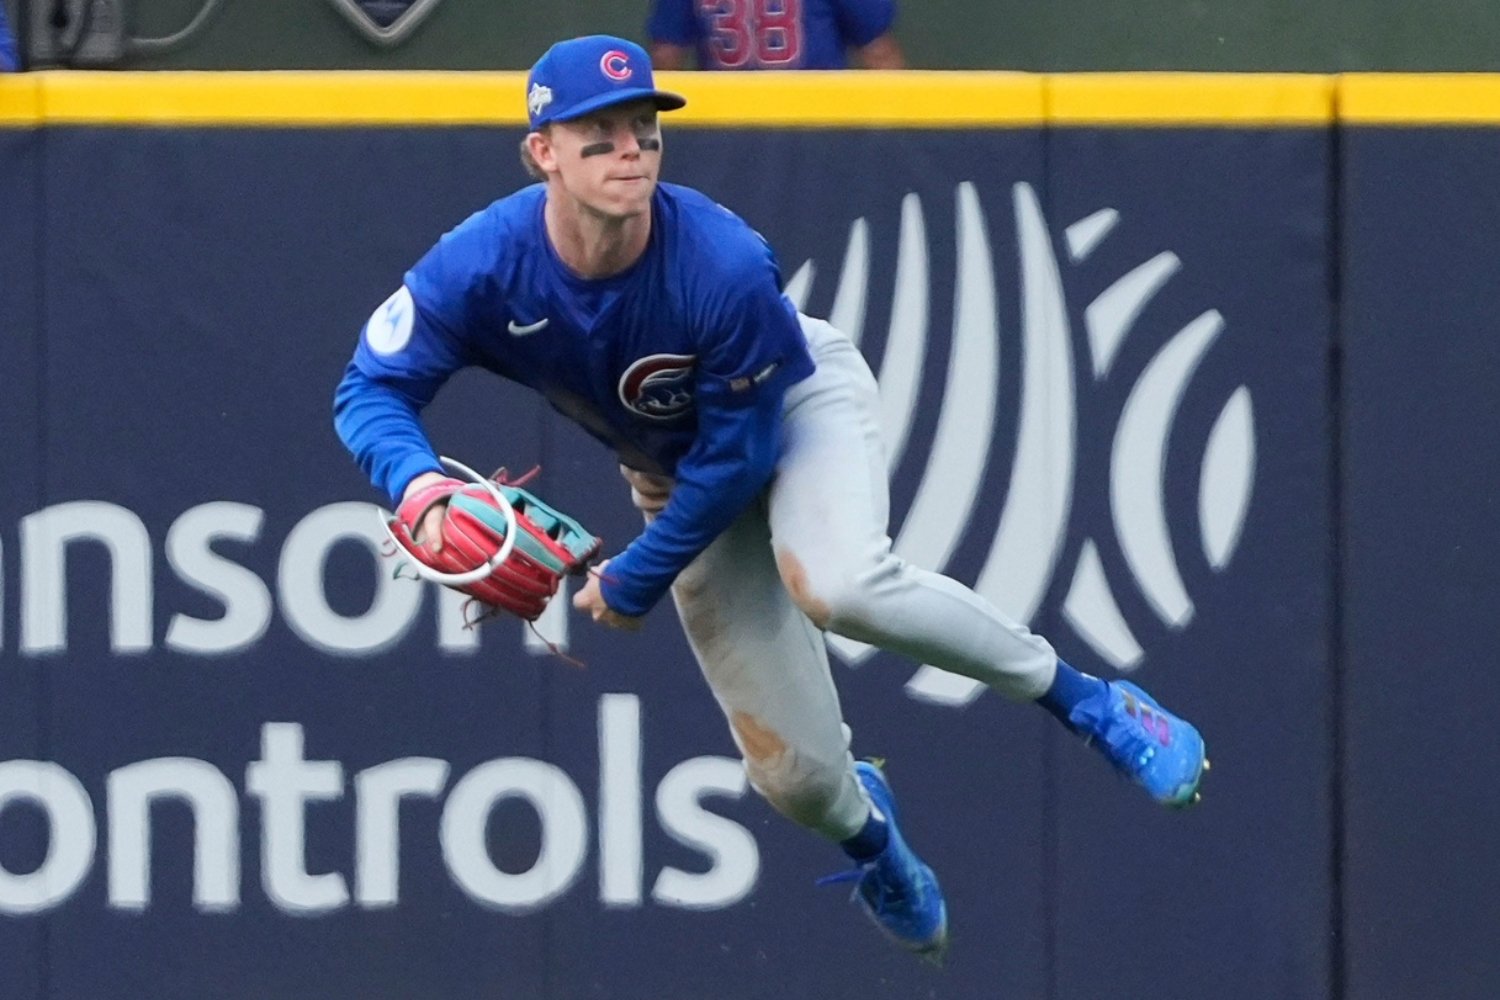 Over the weekend, MLB announced the annual winners for their "Platinum Glove" award, which highlights the single best defensive player in each league. While the Chicago Cubs took home the MLB's team award, they did not have a winner for the individual award; instead, this award for the National League went to Fernando Tatis Jr., who plays right field on the San Diego Padres. I won't shame the guy—he was tied for the league lead in DRS, but Pete Crow-Armstrong probably has a bit of an argument for winning the award outright over Tatis and probably feels a little slighted. Not only did he tie with American League winner Bobby Witt Jr. in Statcast's Outs Above Average for the league lead (24), but he did so at a more defensively demanding position than Tatis. The Cubs' defender lead the world in terms of five-star catches as well. Regardless, this isn't a piece meant to bash the Padres' All-Star, but rather to celebrate the man they call PCA. So, come take ride with me through my five favorite catches on the season made by the Cubs' center fielder. June 4, 2025: Look out for the wall, Pete! TkE5TmJfWGw0TUFRPT1fQkZNSEFnWUVVUVlBQ0FNS1VRQUhCQUJYQUFBR1VWSUFCd0VCVVFwWEFBcGNCd2NB.mp4 I don't care what Statcast says, this is my favorite (and what I'd argue is the most impressive play) of the season that Pete Crow-Armstrong made. Sure, it's still considered a "Five-Star" catch (MLB defines these as catches that only 25% of fielders would make) and this catch had only a 10% catch probability, but Statcast would tell you he had tougher plays to make (and those plays will find their way into this article, so you can be the judge as well). Well, me and the probabilities are going to have a little beef because I think this catch was impossibly hard. First, this play takes Pete Crow-Armstrong a long way; this was his longest distance traveled that registered as a "five-star" catch on the season. But I don't think distance alone should matter, so other context needs to be added. Not every direction an outfielder travels is equal; it's a lot easier to come in than travel back for a ball. This play forces him to turn his back to the plate, and it's a lot harder to track over your shoulder. Lastly, this doesn't take place in a familiar ballpark Crow-Armstrong, as the Cubs make only one yearly trip to Washington. It's actually probably a good thing that it didn't take place in a familiar ballpark— this ball would have been a home run at Wrigley. Plus, he's got to contend with the impact of a padded wall, and still, despite all of that, comes down with the ball. When you add it all up; I think that's an incredible catch. Sorry, Statcast, we just won't agree here. June 17, 2025: Pete Crow-Armstrong saves the day against Milwaukee akQ5Z0FfWGw0TUFRPT1fVjFKV1VnQUhWMVlBV2xjRVh3QUhBRlVDQUFOUVV3TUFDMUlIVVFkVVYxWUVDQUlD.mp4 With the benefit of hindsight, we know that the Cubs didn't win the National League central, but on June 17, it was the Cubs who entered the night with a 5.5-game lead in the division. In a taught one run game, set-up man Caleb Thielbar is tasked with holding on to the lead. Despite a rocky first few appearances, the southpaw has had a great bounce-back season to date, and would need to handle the bottom of the Milwaukee order in the top of the eighth. With one out, Thielbar throws a 93mph heater that probably catches just a little too much of the strike zone, and Brewers' second baseman Brice Turang smokes a line drive to center field. Thankfully for the Cubs, Pete Crow-Armstrong is in center. According to Statcast, he had to cover 71 feet in just 3.8 seconds. So, despite the exit velocity and angle of the hit only scoring ax expected batting average of .280, the defensive positioning of the Cubs' defender added to the difficulty on the play. With only a 5% chance to complete the catch, the swift-footed Crow-Armstrong lays out and gets to the ball before it touches green. Thielbar clearly knows what he just saw, giving a grin of unbelievability. In the end, the Cubs would tack on a fifth run and would win by two, but this play was pivotal in stretching their division lead a little further. June 28, 2025: This is why Pete Crow-Armstrong is special: bmJNNkRfV0ZRVkV3dEdEUT09X1Z3bFRWd0VBQUFNQVhBUUdWd0FIQkFKU0FBQUJCMU1BVjFFTUNRVUdBd0pjQVFVSA==.mp4 When we think of spectacular defensive plays, I think the ones that we tend to gravitate towards and remember are the ones where a player goes all out and either makes a diving catch or runs into a wall; the play has to finish with something that really stands out. What we forget is that one of the reasons a player has to dive is because they couldn't complete the play standing up (speaking from experience, most of the diving plays I've made in my adult league is because I am objectively slow as hell). This is why this play is so good from Crow-Armstrong—he didn't need to go to ground. He made the play look routine. Be honest with yourself: You probably didn't realize that Statcast gave the Cubs' center fielder a 5% catch probability on this one. You probably don't remember this one from the 2025 season. To make this play happen, Pete Crow-Armstrong had under four seconds to travel 68 feet. Not only did he get there, he got there standing up and made it look easy. You'd never come away thinking this was one of his most difficult plays from the eye test. All of this is what makes this a special play, even if I like the play against the Nationals more from a personal standpoint. July 4, 2025: Pete Crow-Armstrong's July 4 Fireworks WU9rbDJfV0ZRVkV3dEdEUT09X1VsQlFWUUlFVkZBQUNRUUhWd0FIVTFkZkFBQUNBRmdBVmdZQkExQlRWQWNCVWd0VQ==.mp4 July Fourth is a day in which we celebrate many things; democracy, personal freedoms, hot dogs and, on this iteration of the national holiday, it was also a celebrate of great defense. The Cubs were still leading the division and their hated rivals, the St. Louis Cardinals, were in town on a Friday afternoon. Frankly, this is the perfect setup for a July Fourth. The Cubs have the surprisingly-effective Colin Rea taking the mound at home. With one out, Cardinals' shortstop Mason Wynn smokes a 105mph line drive off the bat. With an expected batting average of .740 and with a 77th percentile sprint speed, Wynn had to feel like he would be standing on second base pretty easily. Not so fast, my friend. Covering 66 feet in just 3.7 seconds, the center fielder gets a great break on this one. Unlike the play against the Astros, this play is not taking Crow-Armstrong in, but to his glove side. This makes this play a bit trickier; he'll have to move laterally more than north-south. Despite Statcast giving him, yet again, only a 5% chance to make the play, it once again falls harmlessly in Crow-Armstrong's glove for an early out. The Cubs would end up winning 13-3, but taking away an early extra-base hit gave the Cubs a strong platform to explode offensively later. September 1, 2025: Pete Crow-Armstrong helps the Cubs come back TkE5TWJfWGw0TUFRPT1fQlFoVFZGd0ZYd1FBV1ZSUUFBQUhWQU5UQUFOUld3UUFWMVlDVkFzR0NWRlVCd0JR.mp4 The Cubs' young center fielder had an up-and-down year at the plate, looking like the likely NL MVP favorite through the first few months while also looking completely lost in the batter's box during stretches at the end of the season. Thankfully for the Cubs, Crow-Armstrong managed to find ways to impact the game even if he wasn't hitting, and on a chilly day in September he proved as much. The Cubs are down by two against the Braves as the game, and the day, turns to dusk. Aaron Civale, recently acquired off the scrapheap, has given the Cubs a platform to make a comeback; they were down as many as four but have found a few runs to make it tighter. Ozzie Albies, who has a bit of a history of being a Cub killer, steps to the plate, works a full count, and then blisters a 97mph line drive off the relief pitcher. Pete Crow-Armstrong shows off his wheels once again, traveling 92 feet in 4.2 seconds. With a Statcast catch probability of 10% and an expected batting average of .300, it's pretty likely that this ball lands in the gap and the Braves will have a runner in scoring position. Once again, the Cubs' defensive wizard defies probability and makes a wonderful sliding catch. While the play in Washington might be my favorite play of the year, Aaron Civale almost steals the show here for best reaction. The Cubs would eventually come back and win this game 7-6. Maybe the Cubs win regardless of Crow-Armstrong's heroics here—Albies could have been stranded at second and the game may not have changed. But it's plays like this that show what kind of an impact Crow-Armstrong can have in the outfield. Which catch was your favorite? Was there a play I chose not to highlight here? Let us know in the comments below!
 -
Image courtesy of © Jovanny Hernandez / Milwaukee Journal Sentinel / USA TODAY NETWORK via Imagn Images Over the weekend, MLB announced the annual winners for their "Platinum Glove" award, which highlights the single best defensive player in each league. While the Chicago Cubs took home the MLB's team award, they did not have a winner for the individual award; instead, this award for the National League went to Fernando Tatis Jr., who plays right field on the San Diego Padres. I won't shame the guy—he was tied for the league lead in DRS, but Pete Crow-Armstrong probably has a bit of an argument for winning the award outright over Tatis and probably feels a little slighted. Not only did he tie with American League winner Bobby Witt Jr. in Statcast's Outs Above Average for the league lead (24), but he did so at a more defensively demanding position than Tatis. The Cubs' defender lead the world in terms of five-star catches as well. Regardless, this isn't a piece meant to bash the Padres' All-Star, but rather to celebrate the man they call PCA. So, come take ride with me through my five favorite catches on the season made by the Cubs' center fielder. June 4, 2025: Look out for the wall, Pete! TkE5TmJfWGw0TUFRPT1fQkZNSEFnWUVVUVlBQ0FNS1VRQUhCQUJYQUFBR1VWSUFCd0VCVVFwWEFBcGNCd2NB.mp4 I don't care what Statcast says, this is my favorite (and what I'd argue is the most impressive play) of the season that Pete Crow-Armstrong made. Sure, it's still considered a "Five-Star" catch (MLB defines these as catches that only 25% of fielders would make) and this catch had only a 10% catch probability, but Statcast would tell you he had tougher plays to make (and those plays will find their way into this article, so you can be the judge as well). Well, me and the probabilities are going to have a little beef because I think this catch was impossibly hard. First, this play takes Pete Crow-Armstrong a long way; this was his longest distance traveled that registered as a "five-star" catch on the season. But I don't think distance alone should matter, so other context needs to be added. Not every direction an outfielder travels is equal; it's a lot easier to come in than travel back for a ball. This play forces him to turn his back to the plate, and it's a lot harder to track over your shoulder. Lastly, this doesn't take place in a familiar ballpark Crow-Armstrong, as the Cubs make only one yearly trip to Washington. It's actually probably a good thing that it didn't take place in a familiar ballpark— this ball would have been a home run at Wrigley. Plus, he's got to contend with the impact of a padded wall, and still, despite all of that, comes down with the ball. When you add it all up; I think that's an incredible catch. Sorry, Statcast, we just won't agree here. June 17, 2025: Pete Crow-Armstrong saves the day against Milwaukee akQ5Z0FfWGw0TUFRPT1fVjFKV1VnQUhWMVlBV2xjRVh3QUhBRlVDQUFOUVV3TUFDMUlIVVFkVVYxWUVDQUlD.mp4 With the benefit of hindsight, we know that the Cubs didn't win the National League central, but on June 17, it was the Cubs who entered the night with a 5.5-game lead in the division. In a taught one run game, set-up man Caleb Thielbar is tasked with holding on to the lead. Despite a rocky first few appearances, the southpaw has had a great bounce-back season to date, and would need to handle the bottom of the Milwaukee order in the top of the eighth. With one out, Thielbar throws a 93mph heater that probably catches just a little too much of the strike zone, and Brewers' second baseman Brice Turang smokes a line drive to center field. Thankfully for the Cubs, Pete Crow-Armstrong is in center. According to Statcast, he had to cover 71 feet in just 3.8 seconds. So, despite the exit velocity and angle of the hit only scoring ax expected batting average of .280, the defensive positioning of the Cubs' defender added to the difficulty on the play. With only a 5% chance to complete the catch, the swift-footed Crow-Armstrong lays out and gets to the ball before it touches green. Thielbar clearly knows what he just saw, giving a grin of unbelievability. In the end, the Cubs would tack on a fifth run and would win by two, but this play was pivotal in stretching their division lead a little further. June 28, 2025: This is why Pete Crow-Armstrong is special: bmJNNkRfV0ZRVkV3dEdEUT09X1Z3bFRWd0VBQUFNQVhBUUdWd0FIQkFKU0FBQUJCMU1BVjFFTUNRVUdBd0pjQVFVSA==.mp4 When we think of spectacular defensive plays, I think the ones that we tend to gravitate towards and remember are the ones where a player goes all out and either makes a diving catch or runs into a wall; the play has to finish with something that really stands out. What we forget is that one of the reasons a player has to dive is because they couldn't complete the play standing up (speaking from experience, most of the diving plays I've made in my adult league is because I am objectively slow as hell). This is why this play is so good from Crow-Armstrong—he didn't need to go to ground. He made the play look routine. Be honest with yourself: You probably didn't realize that Statcast gave the Cubs' center fielder a 5% catch probability on this one. You probably don't remember this one from the 2025 season. To make this play happen, Pete Crow-Armstrong had under four seconds to travel 68 feet. Not only did he get there, he got there standing up and made it look easy. You'd never come away thinking this was one of his most difficult plays from the eye test. All of this is what makes this a special play, even if I like the play against the Nationals more from a personal standpoint. July 4, 2025: Pete Crow-Armstrong's July 4 Fireworks WU9rbDJfV0ZRVkV3dEdEUT09X1VsQlFWUUlFVkZBQUNRUUhWd0FIVTFkZkFBQUNBRmdBVmdZQkExQlRWQWNCVWd0VQ==.mp4 July Fourth is a day in which we celebrate many things; democracy, personal freedoms, hot dogs and, on this iteration of the national holiday, it was also a celebrate of great defense. The Cubs were still leading the division and their hated rivals, the St. Louis Cardinals, were in town on a Friday afternoon. Frankly, this is the perfect setup for a July Fourth. The Cubs have the surprisingly-effective Colin Rea taking the mound at home. With one out, Cardinals' shortstop Mason Wynn smokes a 105mph line drive off the bat. With an expected batting average of .740 and with a 77th percentile sprint speed, Wynn had to feel like he would be standing on second base pretty easily. Not so fast, my friend. Covering 66 feet in just 3.7 seconds, the center fielder gets a great break on this one. Unlike the play against the Astros, this play is not taking Crow-Armstrong in, but to his glove side. This makes this play a bit trickier; he'll have to move laterally more than north-south. Despite Statcast giving him, yet again, only a 5% chance to make the play, it once again falls harmlessly in Crow-Armstrong's glove for an early out. The Cubs would end up winning 13-3, but taking away an early extra-base hit gave the Cubs a strong platform to explode offensively later. September 1, 2025: Pete Crow-Armstrong helps the Cubs come back TkE5TWJfWGw0TUFRPT1fQlFoVFZGd0ZYd1FBV1ZSUUFBQUhWQU5UQUFOUld3UUFWMVlDVkFzR0NWRlVCd0JR.mp4 The Cubs' young center fielder had an up-and-down year at the plate, looking like the likely NL MVP favorite through the first few months while also looking completely lost in the batter's box during stretches at the end of the season. Thankfully for the Cubs, Crow-Armstrong managed to find ways to impact the game even if he wasn't hitting, and on a chilly day in September he proved as much. The Cubs are down by two against the Braves as the game, and the day, turns to dusk. Aaron Civale, recently acquired off the scrapheap, has given the Cubs a platform to make a comeback; they were down as many as four but have found a few runs to make it tighter. Ozzie Albies, who has a bit of a history of being a Cub killer, steps to the plate, works a full count, and then blisters a 97mph line drive off the relief pitcher. Pete Crow-Armstrong shows off his wheels once again, traveling 92 feet in 4.2 seconds. With a Statcast catch probability of 10% and an expected batting average of .300, it's pretty likely that this ball lands in the gap and the Braves will have a runner in scoring position. Once again, the Cubs' defensive wizard defies probability and makes a wonderful sliding catch. While the play in Washington might be my favorite play of the year, Aaron Civale almost steals the show here for best reaction. The Cubs would eventually come back and win this game 7-6. Maybe the Cubs win regardless of Crow-Armstrong's heroics here—Albies could have been stranded at second and the game may not have changed. But it's plays like this that show what kind of an impact Crow-Armstrong can have in the outfield. Which catch was your favorite? Was there a play I chose not to highlight here? Let us know in the comments below! View full article
-
Kyle Tucker Wins Silver Slugger Award
Jason Ross replied to Matthew Lenz's topic in Chicago Cubs Talk
Again, I'm not in love with these bats. For example, with Pete Alonso, he finished the previous two seasons with a wRC+ in the 120 wRC+ range. At the risk of "ignoring everything he did well, he was bad"-ing Pete's 2025, it really stands out a decent outlier. He's always been a good hitter, but his batted ball data went through the roof last year across the board - career high stuff - even better on the batted ball stuff than his last season in the 140+ wRC+ range. At age-31, I'm not sure I'd expect that moving forward. And while I don't want to horsefeathers on a 120 wRC+ hitter entering the lineup, I don't think the Cubs 2026 offense is better than the 2025 offense, nor do I think it's as good as the 2025 offense. Kyle Schwarber, as well, is off a career year. His ISO went through the roof at age 32. Prior to this, his previous four years (I will exclude his 91 wRC+ during 2020 for a ton of reasons) had him as a 130 wRC+, ranging between 118-145. Only four hitters league wide were 33 years old and had a 130 wRC+ or better. Now, I won't say Schwarber won't do that; I'd probably expect a 130 wRC+ from him, but as he enters ages where bat speed begin to decline (it would appear, we are in the infancy of tracking this data) I become hesitant to think he's going to come anywhere near his career best season. Schwarber at a 130 wRC+ is probably your best bet of getting to a top-5 run scoring offense in 2026. There's also probably an aspect here to remind ourselves that LHH at Wrigley seem to struggle more than their RHH counterparts. How much you want to factor that into here is obviously debatable, they also play 81 games elsewhere, but is probably at the very least worth noting. It's why I said what I said. The offense is going to take a step backwards almost regardless. And I didn't say a "significantly better team", but a significantly better offensive team. When it comes to both Schwarber and Alonso, they probably do increase the offense a good deal over what it is now; but not enough for me to want to attach myself to a positionless player who already have holes in their game. I trust the Cubs to develop their favorite hitter, coupled with a good LHH option to a pretty good hitter as we go. I just think dumping the offseason into the pitching will generally get the Cubs to a better position in 2026 with who is available. You may like these hitters more than me; you probably do if you are making your argument. But neither are my cups for where the Cubs are. -
Kyle Tucker Wins Silver Slugger Award
Jason Ross replied to Matthew Lenz's topic in Chicago Cubs Talk
I really like Dylan Cease and Tatusyua Imai, personally. I'll give people a little hesitation on Imai, but generally speaking, I think the dude is legit from what I can get from the NPB Statcast and the research I've done. Both are $150m players. I like them, probably $/year about more than anyone else on the market, though if you think first-half Tucker is real Tucker, I'll give you him. To be clear; I don't want Suarez or Valdez, either. I will say that in 2026, Framber Valdez, and extreme ground ball pitcher, in Wrigley, with our defense may be a candidate for Cy Young if things break healthy and correct, but long term, I'm probably out (also he seems like a turd for throwing at his catcher). I could do Michael King, but he has to be the second best SP acquired. And yeah, the offense is probably taking a step back. I wouldn't entire ignore the offense in my plan, but my offseason right now would probably be to collect my favorite Caissie/Ballesteros/Long prospect internally and have them be my main DH. I'd pick up a hitter I feel very comfortable will mash LHP (Jo Adell? Alec Bohm? just names) that is available. Maybe this is Okamoto if his market doesn't materialize as a starting 3b option. I feel comfortable that the Cubs develop young hitters well into productive MLB players through the course of a season. Beyond that, I'm taking my leftovers and looking into a trade that probably includes some young arms (Ben Brown, Jordan Wicks, Javier Assad) leaving and either trying to get the cost controlled guy, signing Cease or Imai, or going heavy into the BP (resign Keller, sign Gregory Soto, grab Tyler Kinley, maybe even swim in the Helsey or Devin Williams). The good thing with this plan, IMO, is that it solves the pitching early and if you need to solve a hitting option, you can do that more cheaply at the deadline. This isn't like, a complete idea or thought, it's a lot of hashing it out, trial and error, rough draft stream of consciousness, but it's along my favorite path this offseason. I don't think there's a pathway to being a significantly better offensive team, and I'm not very convinced there's a pathway that even really gets us to equal last year. But I think there is a pathway to being among the best pitching teams in baseball, and that's probably where I'd point the nose of my ship this winter. -
Kyle Tucker Wins Silver Slugger Award
Jason Ross replied to Matthew Lenz's topic in Chicago Cubs Talk
My issue is that I keep coming back to: I don't like any of the other hitters in this market. I might be on an island here, but there just isn't a hitter I like outside of, probably, Kyle Tucker, in terms of fit and form. None of the options at 3b feel like they upgrade over what Shaw is enough to commit $20m or so to; though maybe you can convince me Bo Bichette is worth it. Beyond that, I'm a no on any Bregman deal at this stage, Murakami's contact issues are horrendous and Okamoto has been scouted anywhere between "this guy can play 3b at the MLB" and "only a second division 1b who can't play 3b". For $16m I'm not sure he's going to be a step up over the Shaw package. Kyle Schwarber is a contract I'd stay far away from. Already 33 and a DH only, what little data we have on bat speed seems to suggest that ages 32 and 33 are where batspeed begins to decrease. Already a limited hitter to three true outcomes, I just don't like the back half of that contract. Then you drop to hitters who are all projected at 3 fWAR or lower; Bellinger, Torres, Alonso, Naylor...maybe you try to get someone to slip through the spending crack, but kind of feels more like a lot of these guys have already had that happen before and they probably won't want to go year-to-year again. Ultimately, if the Cubs are going to decide they can't pay Kyle Tucker and it's a non-starter, I'd probably rather the Cubs go heavy into pitching. Both in FA and in trade. -
These are other names I thought of as well! I do think the Cubs will end up with a few off these 7 guys; they just scream "Cub pickups" as they try to rehab their images a little.
-
Four Under-The-Radar Relievers Cubs Should Pursue to Rebuild Bullpen
Jason Ross posted an article in Cubs
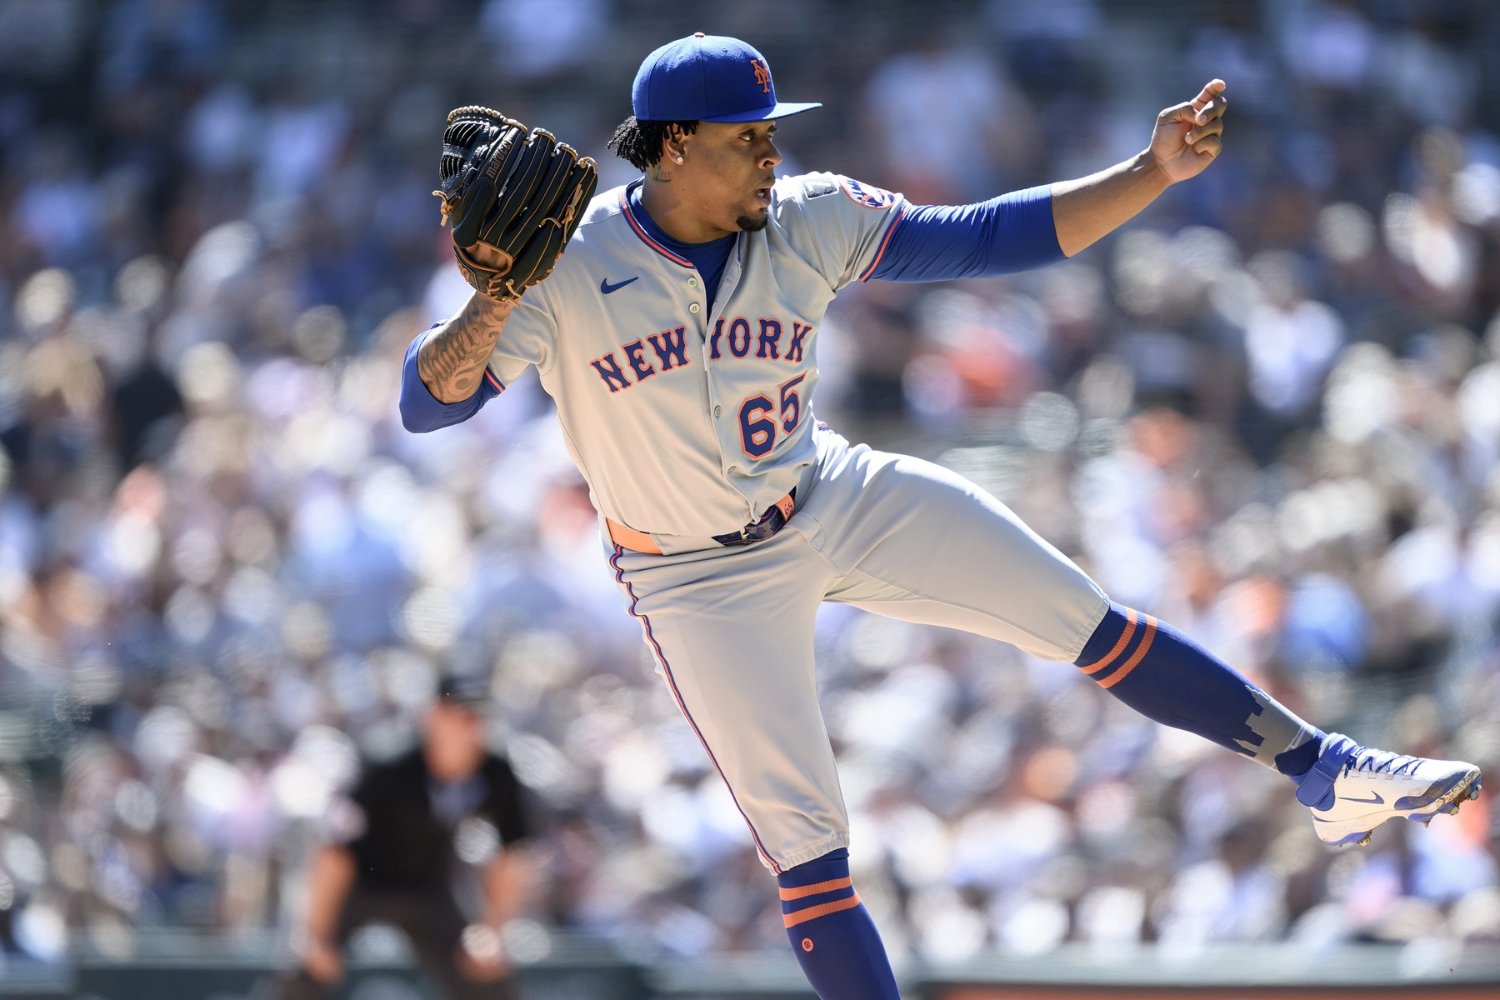 One of the strengths of the 2025 Chicago Cubs lied in their bullpen, despite it being entirely redone on the fly. Finishing with a top-five ERA after May 1, the unit provided a foundation for the Cubs and gave them a good chance to close out any early lead they could secure. However, by way of how the Cubs have built their bullpens in recent years, most of their pieces will not be returning in 2026. Andrew Kittredge has already been traded, instead of having his option picked up, while Caleb Thielbar, Brad Keller, Drew Pomeranz and others are all slated to hit free agency. As the Cubs enter free agency, they will need to replace these pitchers. Some will come through internal means; perhaps Porter Hodge rediscovers his 2024 magic, or someone like Luke Little or Ben Brown pulls a Daniel Palencia and discovers improved command and control. Regardless, they will need to shop outside of the organization as well, as they look to replicate their success. Our own Matt Trueblood outlined some of the biggest options on the market the other day, and while those players would really shore things up, recent reporting from The Athletic's Sahdev Sharma suggests they may not look to go big-game hunting. The Cubs are pretty savvy when it comes to reliever acquisitions, and below are four under-the-radar pickups that I think may interest the Cubs as they look to fill out their bullpen: 1. Gregory Soto, LHP Formerly of the New York Mets in 2025 The North Siders are losing both of their best left-handed options from the 'pen and will need to find a few options from that side. In addition, one thing the Cubs' bullpen last year lacked was swing and miss. Enter Gregory Soto, a left-handed reliever who struck out over 25% of hitters he faced last year. Coming off a season where his ERA sat a tick over four, he shouldn't break the bank for any team looking to sign him. Soto kills lefties, with a 3.53 xFIP against them and just a .232 wOBA against in the 2025 season, but he struggled more against right-handed hitters. The Cubs have taken pitchers such as Colin Rea and swapped out a sinker for a four-seam fastball, and I wonder if they would look to do that with Soto as well. The 2022 campaign was the last season his ERA sat under 4.00, and it was the highest his four-seam usage has been for a while. The Cubs have also had success splitting pitches like they did with Cade Horton, who throws cutter-change to lefties and sinker-slider to righties, and perhaps just getting Soto to throw the four-seam-fastball in on right-handers is the key. This feels like a buy-low candidate that the Cubs can turn into a "two-birds-one-stone" situation by solving both their lack of left-handed pitching in the bullpen and adding swing and miss. 2. Tim Mayza, LHP Formerly of the Pittsburgh Pirates and Philadelphia Phillies in 2025 If the Cubs choose to go "under the radar" with their bullpen choices, Tim Mayza feels like a pitcher they may think they can help. Mayza offers a 94mph fastball from the left side and has had success with Toronto in 2021 and 2022, where, over the course of 155 innings, he was able to put up a 2.67 ERA and a 2.94 xFIP. The wheels fell off for the lefty in 2024 and he had a pretty serious lat injury that cost him most of the season. The lefty came back and featured for the Phillies late in the season and the velocity looked most of the way back, but he clearly struggled with rust. His walk rate was way up (courtesy of a few bad outings) and he struggled to the tune of a near-five ERA in that month. If the Cubs feel like Mayza suffered from a lack of game action and that they can get him back to his previous self, he'd very much fit into their philosophy for building a bullpen of cheap, underrated reclamation projects. They have had success with Caleb Thielbar and Drew Pomeranz, two pitchers of the same mold, and they could find another success story here. 3. Luke Weaver, RHP Formerly of the New York Yankees in 2025 Luke Weaver would help add something the Cubs need more of: strikeouts. The righty struck out 27% of opposing hitters in 2025 and the Cubs really need some more swing and miss in their bullpen. Entering his age-32 season, Weaver has established himself as a useful reliever with the Yankees and is now looking for a new home. The righty uses his fastball a lot and the Cubs were a team who enjoy having pitchers throw their four-seam fastball, so it could be a match made in heaven. Weaver has two things in his profile that may scare teams off, the first being that the righty is an extreme fly-ball pitcher, giving up under 30% of batted balls last year as "groundballs" according to FanGraphs, but this could be something mitigated by Wrigley Field and how pitcher-friendly it has played in recent seasons. The second is that his fastball was almost a full mph down last year, however this seemed to be an early season issue—it tracked upwards as the season went along. You could do a lot worse than going with the former Yankee as a seventh or eighth +inning bridge in 2025 and once again, he's unlikely to break the bank. But if you're going to pass on the Edwin Diaz, Ryan Helsley, Devin Williams tier of relievers, Weaver offers an intriguing option further down the pecking order that could stabilize the backend of a bullpen. 4.Tyler Kinley, RHP Formerly of the Atlanta Braves in 2025 Tyler Kinley isn't going to be at the top of many reliever free agent lists, but there's a really good seventh-inning arm here that is quite reminiscent of Andrew Kittredge. The reliever features a slider that grades out as a 116 on FanGraphs Stuff+ shape rating, and was a +12 in terms of run value. The pitch also generated a 33.3% whiff rate. He probably isn't as good as Kittredge on paper, but there's enough here that you can find to get excited about. Hidden for most of his career in Colorado, and entering his age-35 season, Kinley probably isn't going to break anyone's bank this offseason. There's a pretty good chance that you can acquire Kinley for one year and for less than the $9m Andrew Kittredge is slated to make in 2026 with (now) Baltimore. He probably shouldn't be the best reliever added to the bullpen, but as a secondary addition, he would make a lot of sense and would fit in well with any contending bullpen. What do you think of these four options? Do you think any of them could make sense in the 2026 bullpen? Let us know in the comments below!
 -
Image courtesy of © Lon Horwedel-Imagn Images One of the strengths of the 2025 Chicago Cubs lied in their bullpen, despite it being entirely redone on the fly. Finishing with a top-five ERA after May 1, the unit provided a foundation for the Cubs and gave them a good chance to close out any early lead they could secure. However, by way of how the Cubs have built their bullpens in recent years, most of their pieces will not be returning in 2026. Andrew Kittredge has already been traded, instead of having his option picked up, while Caleb Thielbar, Brad Keller, Drew Pomeranz and others are all slated to hit free agency. As the Cubs enter free agency, they will need to replace these pitchers. Some will come through internal means; perhaps Porter Hodge rediscovers his 2024 magic, or someone like Luke Little or Ben Brown pulls a Daniel Palencia and discovers improved command and control. Regardless, they will need to shop outside of the organization as well, as they look to replicate their success. Our own Matt Trueblood outlined some of the biggest options on the market the other day, and while those players would really shore things up, recent reporting from The Athletic's Sahdev Sharma suggests they may not look to go big-game hunting. The Cubs are pretty savvy when it comes to reliever acquisitions, and below are four under-the-radar pickups that I think may interest the Cubs as they look to fill out their bullpen: 1. Gregory Soto, LHP Formerly of the New York Mets in 2025 The North Siders are losing both of their best left-handed options from the 'pen and will need to find a few options from that side. In addition, one thing the Cubs' bullpen last year lacked was swing and miss. Enter Gregory Soto, a left-handed reliever who struck out over 25% of hitters he faced last year. Coming off a season where his ERA sat a tick over four, he shouldn't break the bank for any team looking to sign him. Soto kills lefties, with a 3.53 xFIP against them and just a .232 wOBA against in the 2025 season, but he struggled more against right-handed hitters. The Cubs have taken pitchers such as Colin Rea and swapped out a sinker for a four-seam fastball, and I wonder if they would look to do that with Soto as well. The 2022 campaign was the last season his ERA sat under 4.00, and it was the highest his four-seam usage has been for a while. The Cubs have also had success splitting pitches like they did with Cade Horton, who throws cutter-change to lefties and sinker-slider to righties, and perhaps just getting Soto to throw the four-seam-fastball in on right-handers is the key. This feels like a buy-low candidate that the Cubs can turn into a "two-birds-one-stone" situation by solving both their lack of left-handed pitching in the bullpen and adding swing and miss. 2. Tim Mayza, LHP Formerly of the Pittsburgh Pirates and Philadelphia Phillies in 2025 If the Cubs choose to go "under the radar" with their bullpen choices, Tim Mayza feels like a pitcher they may think they can help. Mayza offers a 94mph fastball from the left side and has had success with Toronto in 2021 and 2022, where, over the course of 155 innings, he was able to put up a 2.67 ERA and a 2.94 xFIP. The wheels fell off for the lefty in 2024 and he had a pretty serious lat injury that cost him most of the season. The lefty came back and featured for the Phillies late in the season and the velocity looked most of the way back, but he clearly struggled with rust. His walk rate was way up (courtesy of a few bad outings) and he struggled to the tune of a near-five ERA in that month. If the Cubs feel like Mayza suffered from a lack of game action and that they can get him back to his previous self, he'd very much fit into their philosophy for building a bullpen of cheap, underrated reclamation projects. They have had success with Caleb Thielbar and Drew Pomeranz, two pitchers of the same mold, and they could find another success story here. 3. Luke Weaver, RHP Formerly of the New York Yankees in 2025 Luke Weaver would help add something the Cubs need more of: strikeouts. The righty struck out 27% of opposing hitters in 2025 and the Cubs really need some more swing and miss in their bullpen. Entering his age-32 season, Weaver has established himself as a useful reliever with the Yankees and is now looking for a new home. The righty uses his fastball a lot and the Cubs were a team who enjoy having pitchers throw their four-seam fastball, so it could be a match made in heaven. Weaver has two things in his profile that may scare teams off, the first being that the righty is an extreme fly-ball pitcher, giving up under 30% of batted balls last year as "groundballs" according to FanGraphs, but this could be something mitigated by Wrigley Field and how pitcher-friendly it has played in recent seasons. The second is that his fastball was almost a full mph down last year, however this seemed to be an early season issue—it tracked upwards as the season went along. You could do a lot worse than going with the former Yankee as a seventh or eighth +inning bridge in 2025 and once again, he's unlikely to break the bank. But if you're going to pass on the Edwin Diaz, Ryan Helsley, Devin Williams tier of relievers, Weaver offers an intriguing option further down the pecking order that could stabilize the backend of a bullpen. 4.Tyler Kinley, RHP Formerly of the Atlanta Braves in 2025 Tyler Kinley isn't going to be at the top of many reliever free agent lists, but there's a really good seventh-inning arm here that is quite reminiscent of Andrew Kittredge. The reliever features a slider that grades out as a 116 on FanGraphs Stuff+ shape rating, and was a +12 in terms of run value. The pitch also generated a 33.3% whiff rate. He probably isn't as good as Kittredge on paper, but there's enough here that you can find to get excited about. Hidden for most of his career in Colorado, and entering his age-35 season, Kinley probably isn't going to break anyone's bank this offseason. There's a pretty good chance that you can acquire Kinley for one year and for less than the $9m Andrew Kittredge is slated to make in 2026 with (now) Baltimore. He probably shouldn't be the best reliever added to the bullpen, but as a secondary addition, he would make a lot of sense and would fit in well with any contending bullpen. What do you think of these four options? Do you think any of them could make sense in the 2026 bullpen? Let us know in the comments below! View full article
-
It appears the Lions have only promised to post Imai, but haven't seen it confirmed he has been posted yet.
-
I hate being that guy...but this was also my first thought on this list.
-
-
Cubs 2025 Season Review/Offseason Preview Thread
Jason Ross replied to Brandon Glick's topic in Chicago Cubs Talk
He also has a 50% whiff rate on breaking balls. -
Cubs Decline Option, Shota Imanaga Is Now A Free Agent
Jason Ross replied to Matthew Lenz's topic in Chicago Cubs Talk
In almost every situation, there is no such thing as a bad one year deal. If Shota accepts the contract, at 1/$22m, you get a devil you know and one who really wasn't as bad as I think the last few starts made him seem. There was a 10 start run where he was more than capable of outpitching his HR issues. Then he had the last couple of starts and things went off the rails. So you probably feel comfortable if he's your fourth best SP behind Steele, a new guy, Horton and Boyd. If he doesn't accept, you get the comp pick and you look to sign someone else. -
Had a lot of fun on this one. It was good to get back!


