

Davy Andrews
-
Posts
12 -
Joined
-
Last visited
1 Follower

Davy Andrews's Achievements
")


-
Cubs fans had plenty of reasons to be frustrated with the diminutive infielder, but he played a unique style of baseball—one that's worth remembering. Image courtesy of © David Banks-Imagn Images I know that it had to be done. The Cubs are trying, in their own way, to build a contender, and non-tendering Nick Madrigal was the right thing to do. He’s 27 years old, and for every big-league home run he’s hit, he’s appeared on the injury list twice. Without an ounce of power in his bat, Madrigal needs to run a .330 batting average in order to justify a spot in the lineup, and he’s instead batted .251 over the past three seasons. In 2024, he batted just .221, while his defense and baserunning fell off a cliff as well. As Patrick Dubuque and Craig Goldstein noted on Tuesday, Madrigal hit just one ball over the fence in 2024: a ground-rule double. According to FanGraphs, he somehow racked up -0.7 WAR over just 51 games. That made him not just bad, but one of the worst players in baseball. All of this is to say that I understand the problem. I really do. Nevertheless, I reserve the right to feel sad. During his time as a Cub, Madrigal was quite simply a joy to watch, and I will miss him. It's not just that Madrigal represents a throwback to an earlier time, although he certainly does. The 5’8” second baseman (if we're accepting his official, listed height, which is a generous indulgence) used top-of-the-scale bat-to-ball skills to run a .361 average in college. He stole 58 bases and batted leadoff (ahead of teammates Steven Kwan, Adley Rutschman, and Trevor Larnach) for a national champion Oregon State team. He racked up accolades, including Pac-12 Freshman of the Year, Pac-12 Player of the Year, All-Pac-12, and the College World Series All-Tournament Team. Although a broken wrist during his junior year seemed to deprive him of some power that he never quite got back, he went fourth overall in the draft and put up a career .319 batting average in the minor leagues. FanGraphs called him, “the best draft-eligible hitter we saw last year, a complete player with few, if any, flaws.” Through the first two seasons of his big-league career, he batted .317. And he was a gamer. When the Cubs asked him to play third base for the first time since high school—during which time he played there for exactly one inning—Madrigal didn’t miss a beat. If this were, say, 1952, Nick Madrigal would be worshipped as a god. But like I said, it’s not just that. There are plenty of short, gritty, singles hitters out there, but something about Madrigal’s game makes him magnetic. As milquetoast as he tends to be off the field—here’s a long mic’d up segment wherein the only even slightly interesting thing he says is, “They got some bomb pancakes there. Wildberry is fire.”—he’s electric between the lines. Here’s some scouting footage of him in college. Just watch the first 20 seconds or so, and watch how fast his hands are. They’re a blur. It’s like the ball never touches his glove. You don’t have to be a prospect hound to notice that, but just to be clear, those folks noticed it, too. “He has some of the fastest hands I’ve ever seen around the bag,” wrote Eric Longenhagen in 2020. Madrigal also seemed to have a bizarre talent for singling directly off the pitcher. That sounds like an improbable thing to be good at, but it actually makes sense for a batter whose whole game was predicated on the ability to shoot grounders and low line drives through every gap in the infield with outrageous consistency. Just watch: View full article
-
I Know, I Know. But I’m Going To Miss Nick Madrigal Anyway.
Davy Andrews posted an article in Caretakers
.png.27c3cf6da57490c3ec48003bd298a607.png) I know that it had to be done. The Cubs are trying, in their own way, to build a contender, and non-tendering Nick Madrigal was the right thing to do. He’s 27 years old, and for every big-league home run he’s hit, he’s appeared on the injury list twice. Without an ounce of power in his bat, Madrigal needs to run a .330 batting average in order to justify a spot in the lineup, and he’s instead batted .251 over the past three seasons. In 2024, he batted just .221, while his defense and baserunning fell off a cliff as well. As Patrick Dubuque and Craig Goldstein noted on Tuesday, Madrigal hit just one ball over the fence in 2024: a ground-rule double. According to FanGraphs, he somehow racked up -0.7 WAR over just 51 games. That made him not just bad, but one of the worst players in baseball. All of this is to say that I understand the problem. I really do. Nevertheless, I reserve the right to feel sad. During his time as a Cub, Madrigal was quite simply a joy to watch, and I will miss him. It's not just that Madrigal represents a throwback to an earlier time, although he certainly does. The 5’8” second baseman (if we're accepting his official, listed height, which is a generous indulgence) used top-of-the-scale bat-to-ball skills to run a .361 average in college. He stole 58 bases and batted leadoff (ahead of teammates Steven Kwan, Adley Rutschman, and Trevor Larnach) for a national champion Oregon State team. He racked up accolades, including Pac-12 Freshman of the Year, Pac-12 Player of the Year, All-Pac-12, and the College World Series All-Tournament Team. Although a broken wrist during his junior year seemed to deprive him of some power that he never quite got back, he went fourth overall in the draft and put up a career .319 batting average in the minor leagues. FanGraphs called him, “the best draft-eligible hitter we saw last year, a complete player with few, if any, flaws.” Through the first two seasons of his big-league career, he batted .317. And he was a gamer. When the Cubs asked him to play third base for the first time since high school—during which time he played there for exactly one inning—Madrigal didn’t miss a beat. If this were, say, 1952, Nick Madrigal would be worshipped as a god. But like I said, it’s not just that. There are plenty of short, gritty, singles hitters out there, but something about Madrigal’s game makes him magnetic. As milquetoast as he tends to be off the field—here’s a long mic’d up segment wherein the only even slightly interesting thing he says is, “They got some bomb pancakes there. Wildberry is fire.”—he’s electric between the lines. Here’s some scouting footage of him in college. Just watch the first 20 seconds or so, and watch how fast his hands are. They’re a blur. It’s like the ball never touches his glove. You don’t have to be a prospect hound to notice that, but just to be clear, those folks noticed it, too. “He has some of the fastest hands I’ve ever seen around the bag,” wrote Eric Longenhagen in 2020. Madrigal also seemed to have a bizarre talent for singling directly off the pitcher. That sounds like an improbable thing to be good at, but it actually makes sense for a batter whose whole game was predicated on the ability to shoot grounders and low line drives through every gap in the infield with outrageous consistency. Just watch:
I know that it had to be done. The Cubs are trying, in their own way, to build a contender, and non-tendering Nick Madrigal was the right thing to do. He’s 27 years old, and for every big-league home run he’s hit, he’s appeared on the injury list twice. Without an ounce of power in his bat, Madrigal needs to run a .330 batting average in order to justify a spot in the lineup, and he’s instead batted .251 over the past three seasons. In 2024, he batted just .221, while his defense and baserunning fell off a cliff as well. As Patrick Dubuque and Craig Goldstein noted on Tuesday, Madrigal hit just one ball over the fence in 2024: a ground-rule double. According to FanGraphs, he somehow racked up -0.7 WAR over just 51 games. That made him not just bad, but one of the worst players in baseball. All of this is to say that I understand the problem. I really do. Nevertheless, I reserve the right to feel sad. During his time as a Cub, Madrigal was quite simply a joy to watch, and I will miss him. It's not just that Madrigal represents a throwback to an earlier time, although he certainly does. The 5’8” second baseman (if we're accepting his official, listed height, which is a generous indulgence) used top-of-the-scale bat-to-ball skills to run a .361 average in college. He stole 58 bases and batted leadoff (ahead of teammates Steven Kwan, Adley Rutschman, and Trevor Larnach) for a national champion Oregon State team. He racked up accolades, including Pac-12 Freshman of the Year, Pac-12 Player of the Year, All-Pac-12, and the College World Series All-Tournament Team. Although a broken wrist during his junior year seemed to deprive him of some power that he never quite got back, he went fourth overall in the draft and put up a career .319 batting average in the minor leagues. FanGraphs called him, “the best draft-eligible hitter we saw last year, a complete player with few, if any, flaws.” Through the first two seasons of his big-league career, he batted .317. And he was a gamer. When the Cubs asked him to play third base for the first time since high school—during which time he played there for exactly one inning—Madrigal didn’t miss a beat. If this were, say, 1952, Nick Madrigal would be worshipped as a god. But like I said, it’s not just that. There are plenty of short, gritty, singles hitters out there, but something about Madrigal’s game makes him magnetic. As milquetoast as he tends to be off the field—here’s a long mic’d up segment wherein the only even slightly interesting thing he says is, “They got some bomb pancakes there. Wildberry is fire.”—he’s electric between the lines. Here’s some scouting footage of him in college. Just watch the first 20 seconds or so, and watch how fast his hands are. They’re a blur. It’s like the ball never touches his glove. You don’t have to be a prospect hound to notice that, but just to be clear, those folks noticed it, too. “He has some of the fastest hands I’ve ever seen around the bag,” wrote Eric Longenhagen in 2020. Madrigal also seemed to have a bizarre talent for singling directly off the pitcher. That sounds like an improbable thing to be good at, but it actually makes sense for a batter whose whole game was predicated on the ability to shoot grounders and low line drives through every gap in the infield with outrageous consistency. Just watch: -
You Can’t Stop Nico Hoerner From Doubling Down the Line
Davy Andrews posted an article in Caretakers
.png.cbd5cfb6de3684cc7aa53bf747fa5b2b.png) I love Nico Hoerner’s Statcast page. It’s a land of contrasts, as polarized as our stupid country. Any slider that has to do with fielding the ball or making contact with it is so red that it hurts your eyes. Any slider that relates to hitting or throwing the ball hard is blue enough to make the ghost of Harry Caray weep. Not all of this is Hoerner’s fault. The small amount of power he had was sapped by a flexor tendon injury that required surgery once the season ended. From 2023 to 2024, Hoerner’s percentile ranks in hard-hit rate, average exit velocity, and barrel rate all got cut in half. What I really love, though, is below. It’s not polarized at all. It’s perfectly balanced, harmonious even. Nico Hoerner really puts the spray in spray chart. There’s a conspicuous lack of deep fly balls and magenta-colored home runs here, but Horner really does spray the ball all around the ballpark. This season, he pulled the ball 34% of the time, hit it straightaway 37% of the time, and went to the opposite field 29% of the time. That made him one of just 12 qualified players whose rates to all three fields were within 4.5 percentage points of 33.3%. However, there is one tendency that jumps out very clearly on the spray chart. Nearly all of Horner’s doubles are ripped down the left-field line, and nearly all of them are fairly shallow. I was curious about that cluster of blue dots blanketing the line. How is it that Hoerner possesses a rare ability to spray the ball all over the field, but also hits so many of his extra-base hits to the exact same, extreme spray angle?
I love Nico Hoerner’s Statcast page. It’s a land of contrasts, as polarized as our stupid country. Any slider that has to do with fielding the ball or making contact with it is so red that it hurts your eyes. Any slider that relates to hitting or throwing the ball hard is blue enough to make the ghost of Harry Caray weep. Not all of this is Hoerner’s fault. The small amount of power he had was sapped by a flexor tendon injury that required surgery once the season ended. From 2023 to 2024, Hoerner’s percentile ranks in hard-hit rate, average exit velocity, and barrel rate all got cut in half. What I really love, though, is below. It’s not polarized at all. It’s perfectly balanced, harmonious even. Nico Hoerner really puts the spray in spray chart. There’s a conspicuous lack of deep fly balls and magenta-colored home runs here, but Horner really does spray the ball all around the ballpark. This season, he pulled the ball 34% of the time, hit it straightaway 37% of the time, and went to the opposite field 29% of the time. That made him one of just 12 qualified players whose rates to all three fields were within 4.5 percentage points of 33.3%. However, there is one tendency that jumps out very clearly on the spray chart. Nearly all of Horner’s doubles are ripped down the left-field line, and nearly all of them are fairly shallow. I was curious about that cluster of blue dots blanketing the line. How is it that Hoerner possesses a rare ability to spray the ball all over the field, but also hits so many of his extra-base hits to the exact same, extreme spray angle? -
He who defends everything defends nothing, and Nico Hoerner's ability to spray the ball all over the field allows him to rack up hits to the pull side. I love Nico Hoerner’s Statcast page. It’s a land of contrasts, as polarized as our stupid country. Any slider that has to do with fielding the ball or making contact with it is so red that it hurts your eyes. Any slider that relates to hitting or throwing the ball hard is blue enough to make the ghost of Harry Caray weep. Not all of this is Hoerner’s fault. The small amount of power he had was sapped by a flexor tendon injury that required surgery once the season ended. From 2023 to 2024, Hoerner’s percentile ranks in hard-hit rate, average exit velocity, and barrel rate all got cut in half. What I really love, though, is below. It’s not polarized at all. It’s perfectly balanced, harmonious even. Nico Hoerner really puts the spray in spray chart. There’s a conspicuous lack of deep fly balls and magenta home runs here, but Horner really does spray the ball all around the ballpark. This season, he pulled the ball 34% of the time, hit it to straightaway 37% of the time, and went to the opposite field 29% of the time. That made him one of just 12 qualified players whose rates to all three fields were within 4.5 percentage points of 33.3%. However, there is one tendency that jumps out very clearly on the spray chart. Nearly all of Horner’s doubles are ripped down the left field line, and nearly all of them are fairly shallow. I was curious about that cluster of blue dots blanketing the line. How is it that Hoerner possesses a rare ability to spray the ball all over the field, but also hits so many of his extra-base hits to the exact same extreme spray angle? Of Hoerner’s 35 doubles, 23 went to the pull side and traveled under 300 feet. Since the beginning of the Statcast era in 2015, only one player has hit more of that particular kind of double: In 2018, 24 of Nick Castellanos’s 46 doubles met the criteria. But for as long as we’ve been able to measure these things, no one has ever hit as many doubles as Hoerner while pulling such a high rate of them down the line in the form of grounders and low liners. You don’t need light-tower power to rack up this specific kind of extra-base hit. You need great contact skills, quick hands to turn on the inside pitch, and great bat control to keep the ball fair, plus enough power to sneak the ball past the third baseman. In other words, it’s tailor-made for a player like Hoerner, especially when an arm injury has sapped him of his ability to hit the ball over the outfield. Let’s watch a few of the grounders. After watching all those, you might be wondering whether teams started positioning their third baseman deeper against Hoerner or moving them over to guard the line. Some of the defenders in those clips were playing shallow, and some were all the way back at the edge of the dirt, but overall, the answer was no. Teams didn’t cheat back or toward the line. Across the league, third basemen played at an average depth of 119 feet against right-handed batters. When Hoerner was up, they averaged 114 feet, which put him around the 21st percentile. In other words, they played him fairly shallow. I’m sure they would have loved to play back or guard the line, but they didn’t for a fairly simple reason: they couldn’t. Let’s go back to the spray chart. Hoerner sprayed the ball everywhere. See all those singles right back up the middle? They mean that the shortstop has to respect the middle of the field. See all those singles between third and short? They mean that the third baseman can’t cheat toward the line. Hoerner’s modest superpower, the ability to hit the ball to all fields, kept defenses honest. They had no choice but to play him straight up. Hoerner racked up all those pull-side doubles specifically because he doesn't pull the ball all the time! Third basemen definitely couldn’t prevent those doubles by playing deep either. First of all, if they did, Hoerner was likely to injure them. Poor Matt Chapman. He was hands-down the best defensive third baseman in baseball this season, but for whatever reason, Hoerner seemed to take particular delight in tormenting him. The second reason third baseman couldn’t play deep is that Hoerner possesses way too much speed and hits the ball on the ground way too often. According to FanGraphs, he tied for second in all of baseball with 25 infield hits. Nearly 11% of his groundballs went for hits, the eighth-highest mark in baseball. You could argue that teams should have prioritized preventing extra-base hits, but it’s clear that a whole lot of big-league infield coaches disagree with you. Teams across the league decided that playing deep, accepting some extra infield singles as the cost of preventing doubles down the line, just wasn't worth it. Oh, except for the Rangers. When the Cubs visited Texas at the very beginning of the season, the Rangers tried that strategy, playing Hoerner six feet deeper than they played the average right-handed batter. Would you like to guess how that went for them? Hoerner would score the game-winning run three batters later. It’s not just speed that puts pressure on a defense. Defensive positioning is one of the biggest stories in baseball over the last couple of decades. In 2024, the league’s batting average on balls in play was .291, the second-lowest it’s been since 1992, and a big reason for that downturn is those little cards the fielders carry in their back pockets. They know where the batter is likely to hit the ball, and that knowledge allows them to steal would-be hits. But that knowledge can only help you so much, and it’s more helpful against some batters than others (just ask Hall of Famer former baseball player Mark Teixeira). Hoerner’s ability to hit the ball anywhere, supplemented by the speed to beat out infield hits and stretch singles into doubles, means that there is no right place to put your third baseman (or your shortstop, or second baseman). You can’t beat him with an over-shift. You can't shade him to pull. You can't play deep. You can't guard the lines. You have to defend the whole field, and even then, he’ll find the gaps. View full article
-
In 2023, Jameson Taillon's cutter graded out as his second-worst pitch. In 2024, that same cutter graded out as the fourth-best cutter in all of baseball. What happened to it? Like, seriously, what the hell happened to it? Image courtesy of © Chet Strange-Imagn Images Jameson Taillon’s Baseball Savant page is a mess. Savant rates pitchers by their run values, and Taillon’s run values are all over the place. At the very top, his fastball run value is listed at 19 runs, which puts him in the 98th percentile. That’s incredible! But if you look at the individual pitches, you’ll see that his four-seam fastball, the pitch he throws more than any other, was worth exactly zero runs this season, and his sinker was worth four runs. That huge fastball total is coming almost entirely from his cutter, which was worth 15 runs, making it the fourth-most valuable cutter in all of baseball. Last year, though, the same pitch was worth -5 runs, and the year before that, it was worth 0 runs. In 2019, Taillon’s sinker was his best pitch by run value. It was his four-seamer in 2021, his curveball in 2022, his sweeper in 2023, and now his cutter in 2024. If you can make any sense out of the graph below, either you’re a whole lot smarter than I am or you’re imagining things. Like I said, it’s a mess. Based on run values, the only thing we can say for certain is that Taillon’s changeup has always been bad. He added the cutter to his repertoire in 2021, and it was mostly a middling pitch until this year, when it magically turned into Cutter King Kong. How did it suddenly become a great pitch, and will it ever climb the Empire State Building? Let’s start by breaking down what run values are, and why Baseball Savant uses them. At first, it might seem logical to examine a pitch based on an overall metric like wOBA. The problem is that only the last pitch of a plate appearance affects wOBA. A single will always have a wOBA of .882, and strike three will always have a wOBA of .000, but strike one and ball one don’t affect wOBA at all, so you’d be ignoring a huge number of pitches. Run value is calculated by taking the difference between the expected run state before and after each pitch. For example, if the pitcher throws a strike on the first pitch of the inning, the number of runs you’d expect the offense to score in that inning goes down by 0.033. Therefore, that pitch is credited with gaining 0.033 runs for the pitcher. If you the pitcher throws strike one with nobody on and one out, then they only get credited with 0.023 runs, because the extra out meant that the offense was starting with a lower expected run state. It’s not a perfect system, but it allows you to count every pitch. Okay, so back to our original question: How did Taillon’s cutter accrue so much value in 2024? I’m going to start by knocking off a few of the usual suspects. Here’s a list of things that didn’t happen to his cutter in 2024: It didn’t gain a bunch of velocity. Its velocity fell by more than two full ticks, from 88.6 mph to 86.5. It didn’t earn more chases. Its chase rate cratered, going from 34% to 24%. It didn’t earn more whiffs. Its whiff rate cratered too, falling from 27% to 19%. It didn’t start inducing more soft contact. Its exit velocity and hard-hit rate both went up. It didn’t start inducing a bunch more groundballs. Its groundball rate fell from 41% to 38%. It didn’t start inducing more popups. Its popup rate fell from 10% to 7.5%. So, uh, that’s a whole lot of reasons that you’d normally expect a pitch to succeed, and exactly none of them happened. That said, there were some positive changes. View full article
-
.png.24f7148f7838438306c2791132c43aa6.png) Jameson Taillon’s Baseball Savant page is a mess. Savant rates pitchers by their run values, and Taillon’s run values are all over the place. At the very top, his fastball run value is listed at 19 runs, which puts him in the 98th percentile. That’s incredible! But if you look at the individual pitches, you’ll see that his four-seam fastball, the pitch he throws more than any other, was worth exactly zero runs this season, and his sinker was worth four runs. That huge fastball total is coming almost entirely from his cutter, which was worth 15 runs, making it the fourth-most valuable cutter in all of baseball. Last year, though, the same pitch was worth -5 runs, and the year before that, it was worth 0 runs. In 2019, Taillon’s sinker was his best pitch by run value. It was his four-seamer in 2021, his curveball in 2022, his sweeper in 2023, and now his cutter in 2024. If you can make any sense out of the graph below, either you’re a whole lot smarter than I am or you’re imagining things. Like I said, it’s a mess. Based on run values, the only thing we can say for certain is that Taillon’s changeup has always been bad. He added the cutter to his repertoire in 2021, and it was mostly a middling pitch until this year, when it magically turned into Cutter King Kong. How did it suddenly become a great pitch, and will it ever climb the Empire State Building? Let’s start by breaking down what run values are, and why Baseball Savant uses them. At first, it might seem logical to examine a pitch based on an overall metric like wOBA. The problem is that only the last pitch of a plate appearance affects wOBA. A single will always have a wOBA of .882, and strike three will always have a wOBA of .000, but strike one and ball one don’t affect wOBA at all, so you’d be ignoring a huge number of pitches. Run value is calculated by taking the difference between the expected run state before and after each pitch. For example, if the pitcher throws a strike on the first pitch of the inning, the number of runs you’d expect the offense to score in that inning goes down by 0.033. Therefore, that pitch is credited with gaining 0.033 runs for the pitcher. If you the pitcher throws strike one with nobody on and one out, then they only get credited with 0.023 runs, because the extra out meant that the offense was starting with a lower expected run state. It’s not a perfect system, but it allows you to count every pitch. Okay, so back to our original question: How did Taillon’s cutter accrue so much value in 2024? I’m going to start by knocking off a few of the usual suspects. Here’s a list of things that didn’t happen to his cutter in 2024: It didn’t gain a bunch of velocity. Its velocity fell by more than two full ticks, from 88.6 mph to 86.5. It didn’t earn more chases. Its chase rate cratered, going from 34% to 24%. It didn’t earn more whiffs. Its whiff rate cratered too, falling from 27% to 19%. It didn’t start inducing more soft contact. Its exit velocity and hard-hit rate both went up. It didn’t start inducing a bunch more groundballs. Its groundball rate fell from 41% to 38%. It didn’t start inducing more popups. Its popup rate fell from 10% to 7.5%. So, uh, that’s a whole lot of reasons that you’d normally expect a pitch to succeed, and exactly none of them happened. That said, there were some positive changes.
Jameson Taillon’s Baseball Savant page is a mess. Savant rates pitchers by their run values, and Taillon’s run values are all over the place. At the very top, his fastball run value is listed at 19 runs, which puts him in the 98th percentile. That’s incredible! But if you look at the individual pitches, you’ll see that his four-seam fastball, the pitch he throws more than any other, was worth exactly zero runs this season, and his sinker was worth four runs. That huge fastball total is coming almost entirely from his cutter, which was worth 15 runs, making it the fourth-most valuable cutter in all of baseball. Last year, though, the same pitch was worth -5 runs, and the year before that, it was worth 0 runs. In 2019, Taillon’s sinker was his best pitch by run value. It was his four-seamer in 2021, his curveball in 2022, his sweeper in 2023, and now his cutter in 2024. If you can make any sense out of the graph below, either you’re a whole lot smarter than I am or you’re imagining things. Like I said, it’s a mess. Based on run values, the only thing we can say for certain is that Taillon’s changeup has always been bad. He added the cutter to his repertoire in 2021, and it was mostly a middling pitch until this year, when it magically turned into Cutter King Kong. How did it suddenly become a great pitch, and will it ever climb the Empire State Building? Let’s start by breaking down what run values are, and why Baseball Savant uses them. At first, it might seem logical to examine a pitch based on an overall metric like wOBA. The problem is that only the last pitch of a plate appearance affects wOBA. A single will always have a wOBA of .882, and strike three will always have a wOBA of .000, but strike one and ball one don’t affect wOBA at all, so you’d be ignoring a huge number of pitches. Run value is calculated by taking the difference between the expected run state before and after each pitch. For example, if the pitcher throws a strike on the first pitch of the inning, the number of runs you’d expect the offense to score in that inning goes down by 0.033. Therefore, that pitch is credited with gaining 0.033 runs for the pitcher. If you the pitcher throws strike one with nobody on and one out, then they only get credited with 0.023 runs, because the extra out meant that the offense was starting with a lower expected run state. It’s not a perfect system, but it allows you to count every pitch. Okay, so back to our original question: How did Taillon’s cutter accrue so much value in 2024? I’m going to start by knocking off a few of the usual suspects. Here’s a list of things that didn’t happen to his cutter in 2024: It didn’t gain a bunch of velocity. Its velocity fell by more than two full ticks, from 88.6 mph to 86.5. It didn’t earn more chases. Its chase rate cratered, going from 34% to 24%. It didn’t earn more whiffs. Its whiff rate cratered too, falling from 27% to 19%. It didn’t start inducing more soft contact. Its exit velocity and hard-hit rate both went up. It didn’t start inducing a bunch more groundballs. Its groundball rate fell from 41% to 38%. It didn’t start inducing more popups. Its popup rate fell from 10% to 7.5%. So, uh, that’s a whole lot of reasons that you’d normally expect a pitch to succeed, and exactly none of them happened. That said, there were some positive changes. -
.png.9c1c7c50f990e3d158df3fc83f2b73bd.png) I’ll be honest with you. At a certain point, I stopped checking in on Dansby Swanson. The first half of the season was just so disheartening. Some of that was Swanson’s fault, and some of that was simply because baseball is a lot like life, and sometimes life is stupid. In 2022 and 2023, he’d combined to put up a 111 wRC+, which meant that for the first time in his career, Swanson was coming off two straight seasons of above-average production at the plate. According to Statcast, his 30 Fielding Run Value were the most among all shortstops over that period. That combination of good offense and excellent defense gave him 11.5 fWAR, second only to Francisco Lindor’s 11.9. In other words, over those last two years, Swanson was the second-best shortstop in baseball. Then the spring of 2024 happened. In March and April, Swanson ran a wRC+ of 90, while whiffing a third of the time. Then things got worse. He spent the entire month of May in a slump (wrapped around a 12-day absence due to a sprained knee). He ran a wRC+ of just 39 and batted .144; it was the third-worst month of his entire career. Swanson finally looked like himself in June, running a 111 wRC+ and slugging four homers — as many as he’d hit in March, April, and May combined. But rather than going into the break with any kind of momentum or hope, he started July with the coldest stretch of his entire career. Starting on June 30, he ran a six-game hitless streak with just one walk. (Just to satisfy any morbid curiosity you might have, a stretch like that works out to a slash line of .000/.045/.000 and a wRC+ of -87. Yes, that says negative 87. Over those six games, Swanson was 187% worse than the average hitter, so that’s fun.) Swanson didn’t do much better after the break, ending the month of July with a wRC+ of 63. I think that’s around the time I tuned out. Swanson wasn’t feeling great about things, either. When Meghan Montemurro of the Chicago Tribune asked Swanson about his production before the break, he started his answer with, “Production would be a very kind word for you to use.” Looking back, however, it’s clear that I missed some important signs. That’s not to say that Swanson didn’t have some real issues. He definitely did. Still, Swanson actually ran an excellent 45.4% hard-hit rate over the first half, a mark he’s only ever sustained over a full season once. Likewise, his 90.6-mph exit velocity was higher than he’d ever run over a full season. However, his 50.5% groundball rate was the highest of his career. Hard contact is extremely important, but it can only help so much if you’re just beating the ball into the ground. Swanson’s 24% chase rate was also right in line with his career totals, but his swing rate on pitches in the zone dropped to 70.6%, his lowest since 2019. Furthermore, perhaps because he was so passive, pitchers started attacking the strike zone as they never had against him. Before the season, he had a career zone rate of 49.6%. In the first half, it was 52.9%. He saw more breaking stuff, and, somewhat surprisingly, more of that breaking stuff ended up inside the zone. Pitchers were challenging Swanson, and he responded by taking called strikes and grounding out. In 2023, Swanson’s SEAGER score, which rewards hitters for selective aggression – swinging at hittable pitches and laying off balls – ranked in the 95th percentile. Even though his chase rate is excellent as ever, this season, Swanson’s passivity has caused his SEAGER score to fall into the 60th percentile. Swanson doesn’t make a ton of contact or put up top-end exit velocity numbers. Every batter has their limitations, and those are his. They leave a somewhat narrow path to success, and plate discipline is the key to walking that path. Swanson has to avoid chasing, and he has to jump all over hittable pitches. During the first half of the season, he failed to do the latter. Okay, so those last three paragraphs represented some very tangible things that Swanson was doing worse during the first half. However, something else was going on, and it was extremely predictable. What’s the first thing a smart person looks at when a batter’s production suddenly falls off a clip? Their BABIP. Swanson ran a .271 batting average on balls in play during the first half, nearly 40 points below his career average and more than 15 points below the worst season of his entire career. I’m all about digging through the numbers for an explanation, but it’s pretty clear that Swanson was just plain getting unlucky. He ran a .323 expected wOBA and a .277 actual wOBA in the first half. That 46-point gap was the second-largest among all qualified players. Baseball is going to baseball, and there is very little that you can do about that, even when you’re a back-to-back All-Star and Gold Glove winner. That’s one nice thing about the baseball gods: they’re equal-opportunity smiters.
I’ll be honest with you. At a certain point, I stopped checking in on Dansby Swanson. The first half of the season was just so disheartening. Some of that was Swanson’s fault, and some of that was simply because baseball is a lot like life, and sometimes life is stupid. In 2022 and 2023, he’d combined to put up a 111 wRC+, which meant that for the first time in his career, Swanson was coming off two straight seasons of above-average production at the plate. According to Statcast, his 30 Fielding Run Value were the most among all shortstops over that period. That combination of good offense and excellent defense gave him 11.5 fWAR, second only to Francisco Lindor’s 11.9. In other words, over those last two years, Swanson was the second-best shortstop in baseball. Then the spring of 2024 happened. In March and April, Swanson ran a wRC+ of 90, while whiffing a third of the time. Then things got worse. He spent the entire month of May in a slump (wrapped around a 12-day absence due to a sprained knee). He ran a wRC+ of just 39 and batted .144; it was the third-worst month of his entire career. Swanson finally looked like himself in June, running a 111 wRC+ and slugging four homers — as many as he’d hit in March, April, and May combined. But rather than going into the break with any kind of momentum or hope, he started July with the coldest stretch of his entire career. Starting on June 30, he ran a six-game hitless streak with just one walk. (Just to satisfy any morbid curiosity you might have, a stretch like that works out to a slash line of .000/.045/.000 and a wRC+ of -87. Yes, that says negative 87. Over those six games, Swanson was 187% worse than the average hitter, so that’s fun.) Swanson didn’t do much better after the break, ending the month of July with a wRC+ of 63. I think that’s around the time I tuned out. Swanson wasn’t feeling great about things, either. When Meghan Montemurro of the Chicago Tribune asked Swanson about his production before the break, he started his answer with, “Production would be a very kind word for you to use.” Looking back, however, it’s clear that I missed some important signs. That’s not to say that Swanson didn’t have some real issues. He definitely did. Still, Swanson actually ran an excellent 45.4% hard-hit rate over the first half, a mark he’s only ever sustained over a full season once. Likewise, his 90.6-mph exit velocity was higher than he’d ever run over a full season. However, his 50.5% groundball rate was the highest of his career. Hard contact is extremely important, but it can only help so much if you’re just beating the ball into the ground. Swanson’s 24% chase rate was also right in line with his career totals, but his swing rate on pitches in the zone dropped to 70.6%, his lowest since 2019. Furthermore, perhaps because he was so passive, pitchers started attacking the strike zone as they never had against him. Before the season, he had a career zone rate of 49.6%. In the first half, it was 52.9%. He saw more breaking stuff, and, somewhat surprisingly, more of that breaking stuff ended up inside the zone. Pitchers were challenging Swanson, and he responded by taking called strikes and grounding out. In 2023, Swanson’s SEAGER score, which rewards hitters for selective aggression – swinging at hittable pitches and laying off balls – ranked in the 95th percentile. Even though his chase rate is excellent as ever, this season, Swanson’s passivity has caused his SEAGER score to fall into the 60th percentile. Swanson doesn’t make a ton of contact or put up top-end exit velocity numbers. Every batter has their limitations, and those are his. They leave a somewhat narrow path to success, and plate discipline is the key to walking that path. Swanson has to avoid chasing, and he has to jump all over hittable pitches. During the first half of the season, he failed to do the latter. Okay, so those last three paragraphs represented some very tangible things that Swanson was doing worse during the first half. However, something else was going on, and it was extremely predictable. What’s the first thing a smart person looks at when a batter’s production suddenly falls off a clip? Their BABIP. Swanson ran a .271 batting average on balls in play during the first half, nearly 40 points below his career average and more than 15 points below the worst season of his entire career. I’m all about digging through the numbers for an explanation, but it’s pretty clear that Swanson was just plain getting unlucky. He ran a .323 expected wOBA and a .277 actual wOBA in the first half. That 46-point gap was the second-largest among all qualified players. Baseball is going to baseball, and there is very little that you can do about that, even when you’re a back-to-back All-Star and Gold Glove winner. That’s one nice thing about the baseball gods: they’re equal-opportunity smiters. -
The BABIP gods frowned upon Dansby Swanson earlier this year. What, exactly, has he been doing differently of late? Image courtesy of © David Banks-Imagn Images I’ll be honest with you. At a certain point, I stopped checking in on Dansby Swanson. The first half of the season was just so disheartening. Some of that was Swanson’s fault, and some of that was simply because baseball is a lot like life, and sometimes life is stupid. In 2022 and 2023, he’d combined to put up a 111 wRC+, which meant that for the first time in his career, Swanson was coming off two straight seasons of above-average production at the plate. According to Statcast, his 30 Fielding Run Value were the most among all shortstops over that period. That combination of good offense and excellent defense gave him 11.5 fWAR, second only to Francisco Lindor’s 11.9. In other words, over those last two years, Swanson was the second-best shortstop in baseball. Then the spring of 2024 happened. In March and April, Swanson ran a wRC+ of 90, while whiffing a third of the time. Then things got worse. He spent the entire month of May in a slump (wrapped around a 12-day absence due to a sprained knee). He ran a wRC+ of just 39 and batted .144; it was the third-worst month of his entire career. Swanson finally looked like himself in June, running a 111 wRC+ and slugging four homers — as many as he’d hit in March, April, and May combined. But rather than going into the break with any kind of momentum or hope, he started July with the coldest stretch of his entire career. Starting on June 30, he ran a six-game hitless streak with just one walk. (Just to satisfy any morbid curiosity you might have, a stretch like that works out to a slash line of .000/.045/.000 and a wRC+ of -87. Yes, that says negative 87. Over those six games, Swanson was 187% worse than the average hitter, so that’s fun.) Swanson didn’t do much better after the break, ending the month of July with a wRC+ of 63. I think that’s around the time I tuned out. Swanson wasn’t feeling great about things, either. When Meghan Montemurro of the Chicago Tribune asked Swanson about his production before the break, he started his answer with, “Production would be a very kind word for you to use.” Looking back, however, it’s clear that I missed some important signs. That’s not to say that Swanson didn’t have some real issues. He definitely did. Still, Swanson actually ran an excellent 45.4% hard-hit rate over the first half, a mark he’s only ever sustained over a full season once. Likewise, his 90.6-mph exit velocity was higher than he’d ever run over a full season. However, his 50.5% groundball rate was the highest of his career. Hard contact is extremely important, but it can only help so much if you’re just beating the ball into the ground. Swanson’s 24% chase rate was also right in line with his career totals, but his swing rate on pitches in the zone dropped to 70.6%, his lowest since 2019. Furthermore, perhaps because he was so passive, pitchers started attacking the strike zone as they never had against him. Before the season, he had a career zone rate of 49.6%. In the first half, it was 52.9%. He saw more breaking stuff, and, somewhat surprisingly, more of that breaking stuff ended up inside the zone. Pitchers were challenging Swanson, and he responded by taking called strikes and grounding out. In 2023, Swanson’s SEAGER score, which rewards hitters for selective aggression – swinging at hittable pitches and laying off balls – ranked in the 95th percentile. Even though his chase rate is excellent as ever, this season, Swanson’s passivity has caused his SEAGER score to fall into the 60th percentile. Swanson doesn’t make a ton of contact or put up top-end exit velocity numbers. Every batter has their limitations, and those are his. They leave a somewhat narrow path to success, and plate discipline is the key to walking that path. Swanson has to avoid chasing, and he has to jump all over hittable pitches. During the first half of the season, he failed to do the latter. Okay, so those last three paragraphs represented some very tangible things that Swanson was doing worse during the first half. However, something else was going on, and it was extremely predictable. What’s the first thing a smart person looks at when a batter’s production suddenly falls off a clip? Their BABIP. Swanson ran a .271 batting average on balls in play during the first half, nearly 40 points below his career average and more than 15 points below the worst season of his entire career. I’m all about digging through the numbers for an explanation, but it’s pretty clear that Swanson was just plain getting unlucky. He ran a .323 expected wOBA and a .277 actual wOBA in the first half. That 46-point gap was the second-largest among all qualified players. Baseball is going to baseball, and there is very little that you can do about that, even when you’re a back-to-back All-Star and Gold Glove winner. That’s one nice thing about the baseball gods: they’re equal-opportunity smiters. View full article
-
.png.2b120f8f2323041f0ae8d260c1c59835.png) I love watching Nate Pearson pitch. He’s a big, strong guy who stands 6-foot-5, weighs 255 pounds, and yet he throws his fastball like a tiny, strong guy. Pearson releases his fastball 5.42 feet above the ground. Of the 222 pitchers who have thrown at least 300 four-seamers this season, that’s the 37th-lowest release point. For comparison’s sake, Drew Smyly is 6-foot-2, three inches shorter than Pearson, but he releases his sinker more than 14 inches higher, at 6.71 feet. Here’s what that looks like in action. The red lines below show the heights of the two balls at the moment of release. Reminder: the guy on the left is three inches shorter than the guy on the right. Pearson gets low via a few different means: he doesn’t stand as tall as Smyly, his arm angle isn’t as steep, and he gets much farther down the mound. Seriously, look how far forward he is. His front foot very nearly lands on completely flat ground. That last factor also gives Pearson excellent extension. He releases the ball 6.9 feet in front of the rubber, which puts him in the 87th percentile, an entire foot farther than Smyly. Pearson’s four-seamer averages 97.5 mph, but that extension means that its perceived velocity is nearly a full mile per hour faster, giving the batter less time to react. In fact, among those 222 pitchers, it ranks 13th in perceived velocity. There’s just one problem with Pearson’s fastball: It’s performing terribly. Of our 222 pitchers, its .391 wOBA allowed is the 22nd-highest, and its run value of -1.3 runs per 100 pitches is the 13th-lowest. Somehow, this 97.5-mph four-seamer, which plays even faster, is one of the worst in baseball. Stuff+ loves Pearson’s fastball, rating it an excellent 123. However, Location+ gives it a below-average 94. PitchingBot tells the same tale, giving the pitch a 60 for stuff and a 43 for command.
I love watching Nate Pearson pitch. He’s a big, strong guy who stands 6-foot-5, weighs 255 pounds, and yet he throws his fastball like a tiny, strong guy. Pearson releases his fastball 5.42 feet above the ground. Of the 222 pitchers who have thrown at least 300 four-seamers this season, that’s the 37th-lowest release point. For comparison’s sake, Drew Smyly is 6-foot-2, three inches shorter than Pearson, but he releases his sinker more than 14 inches higher, at 6.71 feet. Here’s what that looks like in action. The red lines below show the heights of the two balls at the moment of release. Reminder: the guy on the left is three inches shorter than the guy on the right. Pearson gets low via a few different means: he doesn’t stand as tall as Smyly, his arm angle isn’t as steep, and he gets much farther down the mound. Seriously, look how far forward he is. His front foot very nearly lands on completely flat ground. That last factor also gives Pearson excellent extension. He releases the ball 6.9 feet in front of the rubber, which puts him in the 87th percentile, an entire foot farther than Smyly. Pearson’s four-seamer averages 97.5 mph, but that extension means that its perceived velocity is nearly a full mile per hour faster, giving the batter less time to react. In fact, among those 222 pitchers, it ranks 13th in perceived velocity. There’s just one problem with Pearson’s fastball: It’s performing terribly. Of our 222 pitchers, its .391 wOBA allowed is the 22nd-highest, and its run value of -1.3 runs per 100 pitches is the 13th-lowest. Somehow, this 97.5-mph four-seamer, which plays even faster, is one of the worst in baseball. Stuff+ loves Pearson’s fastball, rating it an excellent 123. However, Location+ gives it a below-average 94. PitchingBot tells the same tale, giving the pitch a 60 for stuff and a 43 for command. -
It's the curious case of a tight end-sized human who can't reach the top shelf. Image courtesy of © Katie Stratman-USA TODAY Sports I love watching Nate Pearson pitch. He’s a big, strong guy who stands 6-foot-5, weighs 255 pounds, and yet he throws his fastball like a tiny, strong guy. Pearson releases his fastball 5.42 feet above the ground. Of the 222 pitchers who have thrown at least 300 four-seamers this season, that’s the 37th-lowest release point. For comparison’s sake, Drew Smyly is 6-foot-2, three inches shorter than Pearson, but he releases his sinker more than 14 inches higher, at 6.71 feet. Here’s what that looks like in action. The red lines below show the heights of the two balls at the moment of release. Reminder: the guy on the left is three inches shorter than the guy on the right. Pearson gets low via a few different means: he doesn’t stand as tall as Smyly, his arm angle isn’t as steep, and he gets much farther down the mound. Seriously, look how far forward he is. His front foot very nearly lands on completely flat ground. That last factor also gives Pearson excellent extension. He releases the ball 6.9 feet in front of the rubber, which puts him in the 87th percentile, an entire foot farther than Smyly. Pearson’s four-seamer averages 97.5 mph, but that extension means that its perceived velocity is nearly a full mile per hour faster, giving the batter less time to react. In fact, among those 222 pitchers, it ranks 13th in perceived velocity. There’s just one problem with Pearson’s fastball: It’s performing terribly. Of our 222 pitchers, its .391 wOBA allowed is the 22nd-highest, and its run value of -1.3 runs per 100 pitches is the 13th-lowest. Somehow, this 97.5-mph four-seamer, which plays even faster, is one of the worst in baseball. Stuff+ loves Pearson’s fastball, rating it an excellent 123. However, Location+ gives it a below-average 94. PitchingBot tells the same tale, giving the pitch a 60 for stuff and a 43 for command. View full article
-
Tyson Miller throws his sweeper a lot, and that’s a good thing. He’s thrown it 43% of the time this season, but over his last five appearances, he’s led with the pitch, throwing it right around 60% of the time. It’s not hard to see why. The pitch has a .181 batting average, and according to Statcast’s run values, it’s been worth six runs. On a per-pitch basis, that makes it the fifth-most valuable slider and 22nd-most valuable pitch in all of baseball (minimum 150 pitches). It's an elite offering. But the pitch isn't just effective, it's also very, very fun. Image courtesy of © Jeff Le-USA TODAY Sports As you may know, the benefit of throwing a sweeper rather than a traditional, harder slider is that it induces more soft contact. There are also two downsides. First, sweepers tend to fare worse against opposite-handed hitters. Miller, is very aware of that; he’s thrown it more than twice as often to righties as he has to lefties. The second downside to the sweeper is that it can miss fewer bats, since its goal is to maximize horizontal break, and vertical break is the thing that really makes the whiffs happen. Those generalities have held true for Miller’s sweeper. If we look at pitchers who have thrown at least 150 sliders, here’s where Miller’s sweeper ranks: even though it induces tons of chases, it’s got a whiff rate of 29%, which ranks a bit below average. On the other hand, it’s got a 22% hard-hit rate, which puts it in the eighth percentile. The pitch also exceeds its expected stats. Its .158 wOBA is 45 points below its already extremely low xwOBA of .203. The reason for this is simple: expected stats don’t take spray angle into account, and Miller excels at keeping the ball in the big part of the ballpark. Batters have pulled Miller’s slider just 28% of the time this season. Out of the 271 pitchers who have allowed at least 10 sliders to be put in play this year, that’s the third-lowest pull rate. That’s huge, because the pull side is where batters do real damage. This season, batters have a .438 wOBA when they pull the ball, and a .311 wOBA when they hit it to center or go the other way. In other words, when batters pull the ball, they’re better than Shohei Ohtani, and when they hit it somewhere else, they’re Jeremy Peña. Here’s a spray chart that shows Miller’s balls in play on the sweeper. Look at all those grounders to the middle infielders and harmless fly balls to center. View full article
-
Does Tyson Miller Have the Sweepiest Sweeper in Baseball?
Davy Andrews posted an article in Caretakers
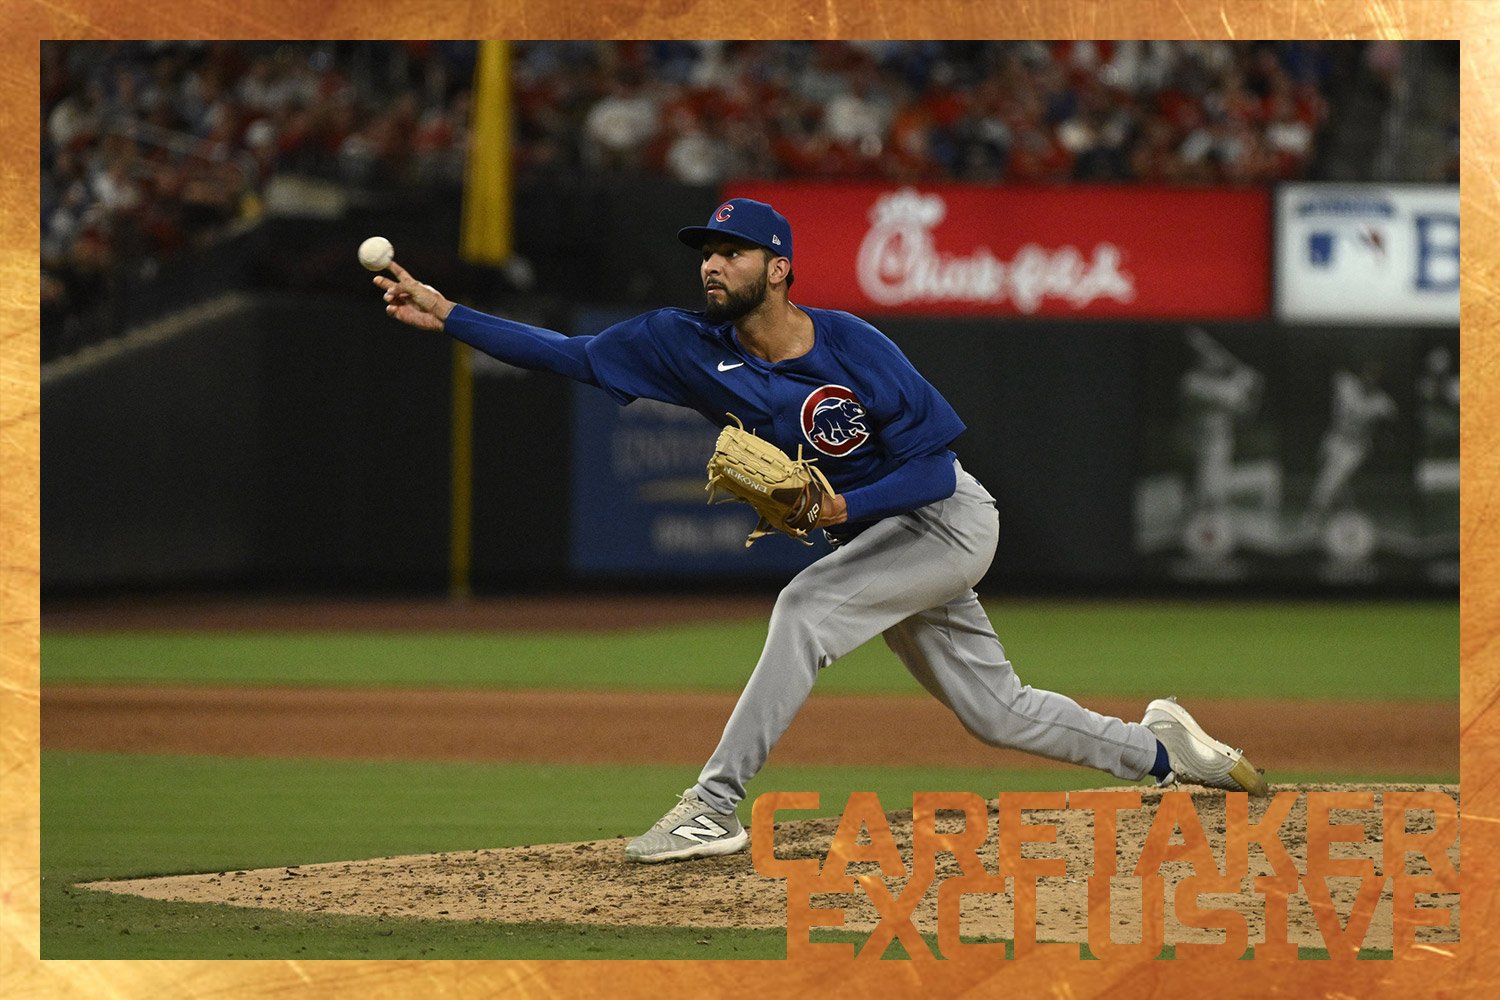 As you may know, the benefit of throwing a sweeper rather than a traditional, harder slider is that it induces more soft contact. There are also two downsides. First, sweepers tend to fare worse against opposite-handed hitters. Miller, is very aware of that; he’s thrown it more than twice as often to righties as he has to lefties. The second downside to the sweeper is that it can miss fewer bats, since its goal is to maximize horizontal break, and vertical break is the thing that really makes the whiffs happen. Those generalities have held true for Miller’s sweeper. If we look at pitchers who have thrown at least 150 sliders, here’s where Miller’s sweeper ranks: even though it induces tons of chases, it’s got a whiff rate of 29%, which ranks a bit below average. On the other hand, it’s got a 22% hard-hit rate, which puts it in the eighth percentile. The pitch also exceeds its expected stats. Its .158 wOBA is 45 points below its already extremely low xwOBA of .203. The reason for this is simple: expected stats don’t take spray angle into account, and Miller excels at keeping the ball in the big part of the ballpark. Batters have pulled Miller’s slider just 28% of the time this season. Out of the 271 pitchers who have allowed at least 10 sliders to be put in play this year, that’s the third-lowest pull rate. That’s huge, because the pull side is where batters do real damage. This season, batters have a .438 wOBA when they pull the ball, and a .311 wOBA when they hit it to center or go the other way. In other words, when batters pull the ball, they’re better than Shohei Ohtani, and when they hit it somewhere else, they’re Jeremy Peña. Here’s a spray chart that shows Miller’s balls in play on the sweeper. Look at all those grounders to the middle infielders and harmless fly balls to center.

.png.9c1c7c50f990e3d158df3fc83f2b73bd.png)
.png.2b120f8f2323041f0ae8d260c1c59835.png)
