
Kyle Hendricks' velocity, or lack thereof, has caused a lot of panic in Wrigleyville. This isn't quite a doomsday scenario, though. Perhaps I've deluded myself, but I'm ready to take the jump and ride that 84 mph fastball all the way back to the World Series.
I'll admit, when I first saw Kyle throwing 84 mph fastballs, I was alarmed. Hendricks had spent his first three years in the majors with a sinker that sat above 88 mph. And in two of his first three games this year, while he got off to a sub-par start, his sinker averaged less than 85 mph. I was cautiously optimistic because Hendricks started out last year at a lower velocity, before ramping it up as the season went along. Hendricks did see his velocity rise again this year after the scary April, with his sinker averaging over 86 mph in May and June before a hand injury shut him down for nearly two months.
Since he's been back, he's made three starts, and his average sinker velocity is back below 85 mph. He's shown the ability to get it over 86. In his July 29 start, his sinker averaged under 85 in the 1st inning but was all the way up to a blazing 86.3 mph in the 6th inning. Again on Friday, his velocity was below 85 in the first inning before shooting up later in the game. Still, 85 mph is scary. As is 86 mph. Hendricks already was working at velocities that are uncommon for major league pitchers, and that was 3 mph ago.
Before we get any further, it should be mentioned that MLB is measuring velocity differently this year. And the transition was a little rocky. Early in the year, as Michael Cerami showed at Bleacher Nation, Cubs' starters were throwing a lot faster on the road than at Wrigley Field. So it might be a fool's errand to try to make sense of this whole velocity mess. In fact, it might be wise to avoid comparing velocity readings from this year to one's from the past, since they were gathered by a different method. However, the new system has made velocity go up league-wide. And, while Hendricks is throwing 85, other Cubs, like Hector Rondon, aren't having the same issues replicating previous years' velocities.
It may seem like slim pickin's when looking for positives with Kyle. Nevertheless, I'm here to tell you that there are a lot of reasons to believe that Kyle will be really good the rest of the year.
First of all, he's been pretty good so far this year. His ERA is 3.81. While that might not seem up to expectations, following his 2.13 ERA last year, it's still plenty acceptable in this juiced ball era. Adjusted for park and league, his ERA- of 89 ranks 44th of 130 starters that have pitched at least 70 innings. The average NL ERA for a starting pitcher is 4.43.
Hendricks' FIP and xFIP are both better than league average, too. There's a bit of a discrepancy there, though. Hendricks' 4.30 FIP is well above his 3.97 xFIP, thanks to a sky high HR/FB rate. FIP is more reliable than ERA and is scaled so that the average FIP matches the average ERA. xFIP replaces a pitcher's HRs given up with the league average HR/FB. I think Hendricks' HR/FB rate is fluky high. And I expect it to drop precipitously.
I wrote an article in late April arguing that several Cubs' pitchers had fluky HR/FB rates that were causing issues that wouldn't continue. At the time, Jake Arrieta's HR/FB was 21.4%. It's now 14.4%. His did drop, and he has seen better results because of it. Hendricks' HR/FB is still about the same as it was then. Granted, he hasn't had as long to lower it, on account of his missed time. But I still think it's bound to drop.
I'm going to borrow a few charts that I used in that piece and check in on how Hendricks is proceeding in a few areas that I examined in April. This first chart shows the correlation between a pitcher's average exit velocity on fly balls and line drives and HR/FB. My sample includes all 118 pitchers that pitched at least 120 innings last year. The correlation between EV on FB&LD and HR/FB was .4613.
http://i.imgur.com/DCZKbwW.png
This next chart shows the correlation between the average batted ball distance on fly balls and line drives and HR/FB. The correlation between the two for the same sample was .5298.
http://i.imgur.com/PKY6W2v.png
The next chart will show the correlation between the % of a pitcher's pitches that are "barreled" and HR/9. Barrels are a new stat being kept this year using Statcast data. Not all barreled balls are home runs, and not all home runs are barreled. But, barreled balls are hit hard and at launch angles that are conducive to power. The league average slugging% on barreled balls this year is 2.871. The correlation between the % of pitches that are barreled and HR/9, using the same sample as before, is .6976.
http://i.imgur.com/GP4taQR.png
http://i.imgur.com/fCr0oQH.png
That's the fourth stat that we've found with a correlation that is somewhere between medium to strong -- for either HR/FB or HR/9. Of the 153 pitchers that have pitched at least 60 innings this year, Kyle Hendricks' HR/FB is the 116th lowest. His HR/9 is 81st lowest.
Tony Blengino at Fangraphs recently released his ball-in-play-based park factor update. In it, Wrigley was shown to have favorable fly ball conditions for hitters. It has been 8.5% more favorable than the average park. Miller Park and Great American Ballpark have been very favorable to hitters, but Busch Stadium has been one of the least hitter-friendly parks in baseball. We might expect Cubs' pitchers to have a little worse production than their batted-ball data would suggest, but it shouldn't be anything too crazy. It's not like they are playing half their games in Coors.
Back to those charts above; let's see how Kyle is faring in some areas that help determine how many homers you give up. Out of 155 pitchers that have thrown at least 1,000 pitches this year, Hendricks has the 73rd lowest average exit velocity on fly balls and line drives. He has the 19th lowest average batted ball distance on fly balls and line drives. He has the 34th lowest % of pitches that are barreled. And he has the 27th lowest % of pitches that are batted at launch angles between 20° and 35°.
There's really no reason for Hendricks to have one of the highest HR/FB rates in the league. The homers are fluky. They'll go away if he keeps pitching like this. He's done a good job of limiting dangerous contact. He's a fantastic contact manager. He always has been. I wrote an article last year explaining how he was able to manage contact at such an elite level. The basics: He induces a lot of ground balls; he gets more pop-ups than any ground-ball pitcher, outside of Clayton Kershaw; he avoids that launch angle danger zone we talked about earlier by getting a lot of lazy fly balls; and hitters hit the ball weakly off of him.
Hendricks' GB% is up from 48.4% in '16 to 49.8% this year. His infield-fly ball% is up from 9.3% to 10.6%. His average exit velocity is down from 85.8 mph to 85.0 mph, which is the 15th lowest of the 155 pitchers that have thrown at least 1,000 pitches. He's getting the same type of weak contact that he was getting last year when he led the majors in ERA. It defies logic that he is doing it while throwing 84 mph sinkers. But he is.
It doesn't make much sense, but velocity just doesn't matter very much to Kyle. He's good now for the same reasons he was good before. He has pinpoint command. He knows how to mix-and-match to keep hitters off-balance. You know the spiel on The Professor. But I'd like to show you just how good he is at those things.
In my last article, about Jon Lester, I mentioned a new stat that the people at Baseball Prospectus created:
It probably wouldn't surprise you to hear that Kyle Hendricks and Jon Lester are good at a lot of the same, unseen aspects of pitching. They both just know how to pitch. Their stuff plays up, for reasons that are hard to decipher. Hendricks ranks 5th in Release:Tunnel Ratio, among pitchers that have thrown as many pitches as he has. In terms or release differential, Lester and Hendricks rank first and second.
Lester and Hendricks both throw multiple pitches and release them all from practically the exact same spot. The pitches then travel down the same tunnels toward the batter. And their pitches are nearly indistinguishable until it's too late for the batter to decide to swing or not.
That's why batters often look clueless against his underwhelming stuff. They simply can't tell if the sinker is coming or if it's the change. It allows his velocity to play up because the flight of the ball tells the batter nothing. He is still left with very little time to decide how to approach the pitch.
What complicates the task of facing Hendricks even more is his ability to work around the edges of the zone. It's hard to tell if it's a strike when it's close, and it's also hard to drive the ball with authority when it's kept out of the middle of the zone. And Kyle works the edges like hardly anyone else. At Baseball Savant you can search by which pitches are around the edges. The zone looks like this:
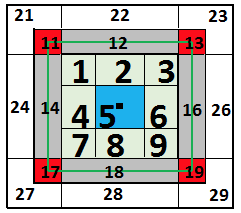
We're going to search for all pitches thrown in the boxes with the green line (which represents the edge of the zone) running through them. At 43.5%, Kyle throws a higher percent of his total pitches in these boxes than anyone else in the league, out of the 155 pitchers that have thrown at least 1,000 pitches. 33% of his pitches end up with the batter swinging at a pitch, or a called strike, on the edges -- the second-highest total in the league, behind Dallas Keuchel. That's a very good thing, considering that hitters only slug .359 against Hendricks on pitches on the edges. Here is his pitch chart for these pitches:
http://i.imgur.com/iYtyyYB.png
By working the edges, Hendricks also gets a lot of pitches out of the zone called as strikes. He has the seventh-highest percent of his total pitches go for called strikes on pitches outside of the zone. He also has the second-highest percent of pitches that go for called strikes on pitches in the zone and on the edges, again behind Keuchel. Here is his pitch chart for these called strikes:
http://i.imgur.com/VOZwnbi.png
Hendricks also has the tenth-highest percent of pitches -- located anywhere -- that are called third strikes.
Perhaps more important than hitting the edges is avoiding the heart of the plate, especially for a guy throwing in the mid-80s. As I tweeted after his first start back from the DL, "On his last pitch of the game, we saw what happens when you leave an 85 mph fastball over the middle of the plate." On that pitch, Jose Abreu smacked a double against the vines to tie the game and chase Hendricks from the mound. The league slugs .636 on all pitches in the blue box in the middle of the zone from earlier. It would behoove Kyle to stay away from there.
Guess what? He does avoid the middle of the zone. He throws the third-fewest % of pitches in that blue box. The thing that really surprised me, though, is that opponents are only slugging .444 when Kyle leaves one in the middle of the zone, which is the 21st-lowest mark in the league. Which brings me back to my original point: Velocity doesn't matter very much to Kyle Hendricks.
On sinkers of at least 86 mph this year, opponents have slugged .500 against Hendricks. On sinkers between 85 mph and 86 mph, they've slugged .410. On sinkers between 84 mph and 85 mph, they've slugged .293. And on sinkers less than 84 mph, they've slugged .000.
Indubitably, that's really fluky. He isn't actually better when he is throwing slower. Last year, opponents slugged .363 against Hendricks' sinkers that were above 88 mph. They slugged .417 when his sinker was below 88 mph. Velocity does matter. But, with Hendricks, location and command are probably more important. That's not the case with other guys, like John Lackey, who rely on stuff more than moxie. But it's mostly true with Hendricks.
(Interestingly, Hendricks threw 61.9% of his sinkers in the zone when his sinker was below 88 mph last year. He only threw 50.9% of his sinkers in the zone when he was above 88 mph. When you factor in the extra walks, whether he was above or below 88, the difference in his overall effectiveness was negligible. His wOBA when he was over 88 mph was .310. His wOBA when he was under 88 was .314. The wOBA difference between his sinker when above and below 88 mph was within .003 in 2015, too. Feasibly, is he able to off-set the difference in stuff with better control?)
One area where Hendricks' velocity does matter is in the separation of velocity between his changeup and his sinker. As I wrote in my article about the rotation in April:
Hendricks' changeup has typically been 7.5-8 mph slower than his sinker. There was definitely something off during Hendricks' second and third starts of the season. During his April 19 start, in particular, his average sinker velocity was only 84.1 mph. The difference between his sinker and changeup was 6.0 mph. And he was getting a lot less sink than he usually gets on both his sinker and changeup. He also gave up 4 walks and 2 homers in that April 19 start.
After that game, things got better. The separation between his sinker and changeup has mostly been 6.5-7 mph since then. And his changeup has been more lethal since he came off the DL. According to Fangraphs' pitch values, Hendricks' changeup was the most valuable changeup in the league last year. Since Hendricks entered the league in 2014, his changeup has been worth 37 runs above the average changeup. It had been a below-average pitch this year, according to pitch values, until Friday. In that April 19 start alone, it was worth -3.3 runs. It's been worth 3.5 runs over Hendricks' first three starts since returning in July.
Hendricks uses his changeup to get whiffs. Across his career, hitters have only made contact on his changeup on 64.1% of their swings. They are making contact on 72.1% of their swings at it this year. He has made progress as he's bumped up the separation, though. After hitter's made contact on 90% of his changeups over his unamiable second and third starts of the season, they've only made contact on 68.8% of swings since. He's getting even more whiffs since coming off the DL.
Hendricks' K/9 is down from 8.04 last year to 7.38 this year. It will probably stay that low unless there is some semblance of a velocity spike to his sinker. His changeup just isn't going to be as effective at a 6-7 mph separation.
Hendricks has also had a bit of a problem with walks this year. His BB/9 is up from 2.08 last year to 2.65 this year. This seems to be an issue he's corrected, though. For his career, he's thrown 64.9% of his pitches for strikes. Before going to the DL, he'd only thrown 62.2% of his pitches for strikes. Since coming back, 66.5% of his pitches have been strikes, as he's walked only 2 in 16.1 IP.
Altogether, he's been really good since that April 19 ordeal. In his last 11 starts, he's posted a 3.19 ERA and a 3.84 FIP. I'm expecting him to finish off the year somewhere along those same lines.
Right now I probably seem like this:
http://i.imgur.com/c4jt321.png
I promise I'm not disregarding this calamity, though. This is not fine. It is worrisome. But, I am more worried about if Hendricks is healthy or not. Is the velocity loss a harbinger of a future arm surgery? Is this going to get worse? What's going to happen if he is throwing 82 by October? What about next year? It is a little frightening. Hendricks is not the same guy he was last year. But, the 85 mph version of Kyle can still be a good pitcher.
As for the 88 mph version of Kyle, hopefully...
We'll Meet Again.

Recommended Comments
There are no comments to display.
Create an account or sign in to comment
You need to be a member in order to leave a comment
Create an account
Sign up for a new account in our community. It's easy!
Register a new accountSign in
Already have an account? Sign in here.
Sign In Now